
Figure 3. Luteolin-induced apoptosis in human TK6 cells.
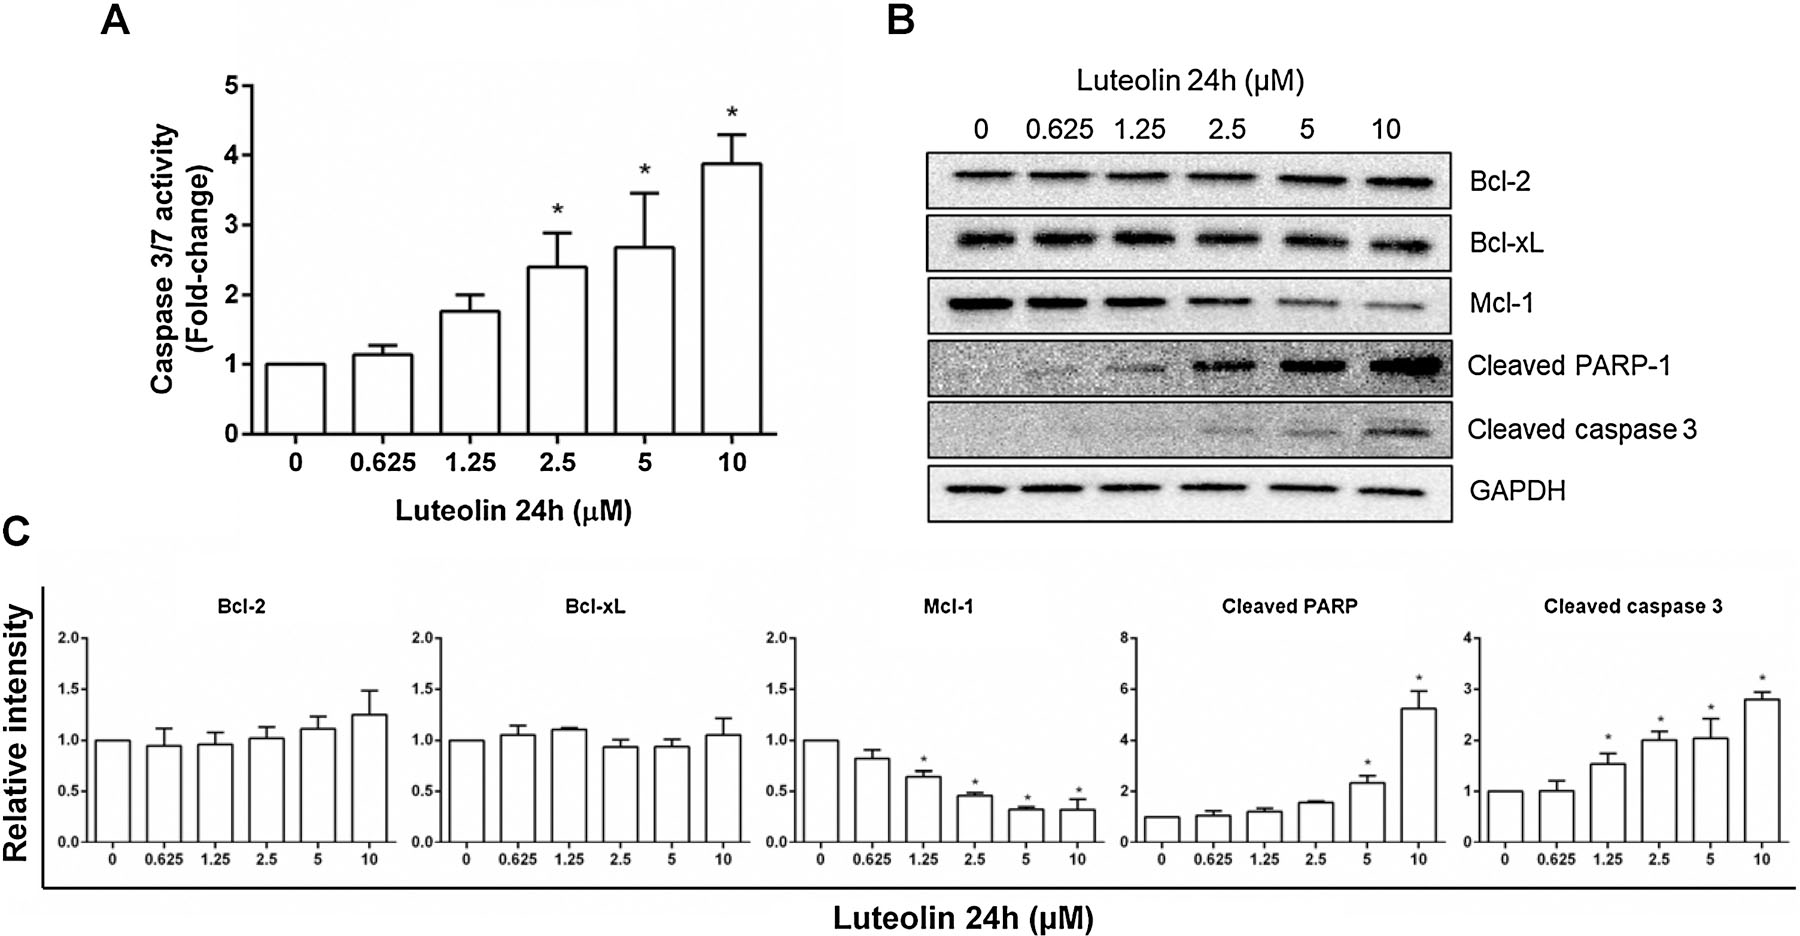
Cells were treated at the indicated concentrations for 24 h. (A) Histogram shows the caspase 3/7 activity as fold-change relative to the vehicle control from three independent experiments (mean ± SD). (B & C) Western blot shows the protein expression of Bcl-2, Bcl-xL, Mcl-1, cleaved PARP-1, and cleaved caspase 3 in treated cells (B); all proteins were quantified and normalized to the amount of GAPDH, then expressed as the mean ± SD from three independent experiments (C). * indicates P < 0.05 comparing to the vehicle controls.