
Figure 6. Luteolin-induced apoptosis, DNA damage, and cell cycle changes in the CYP1A1-expressing TK6 cells.
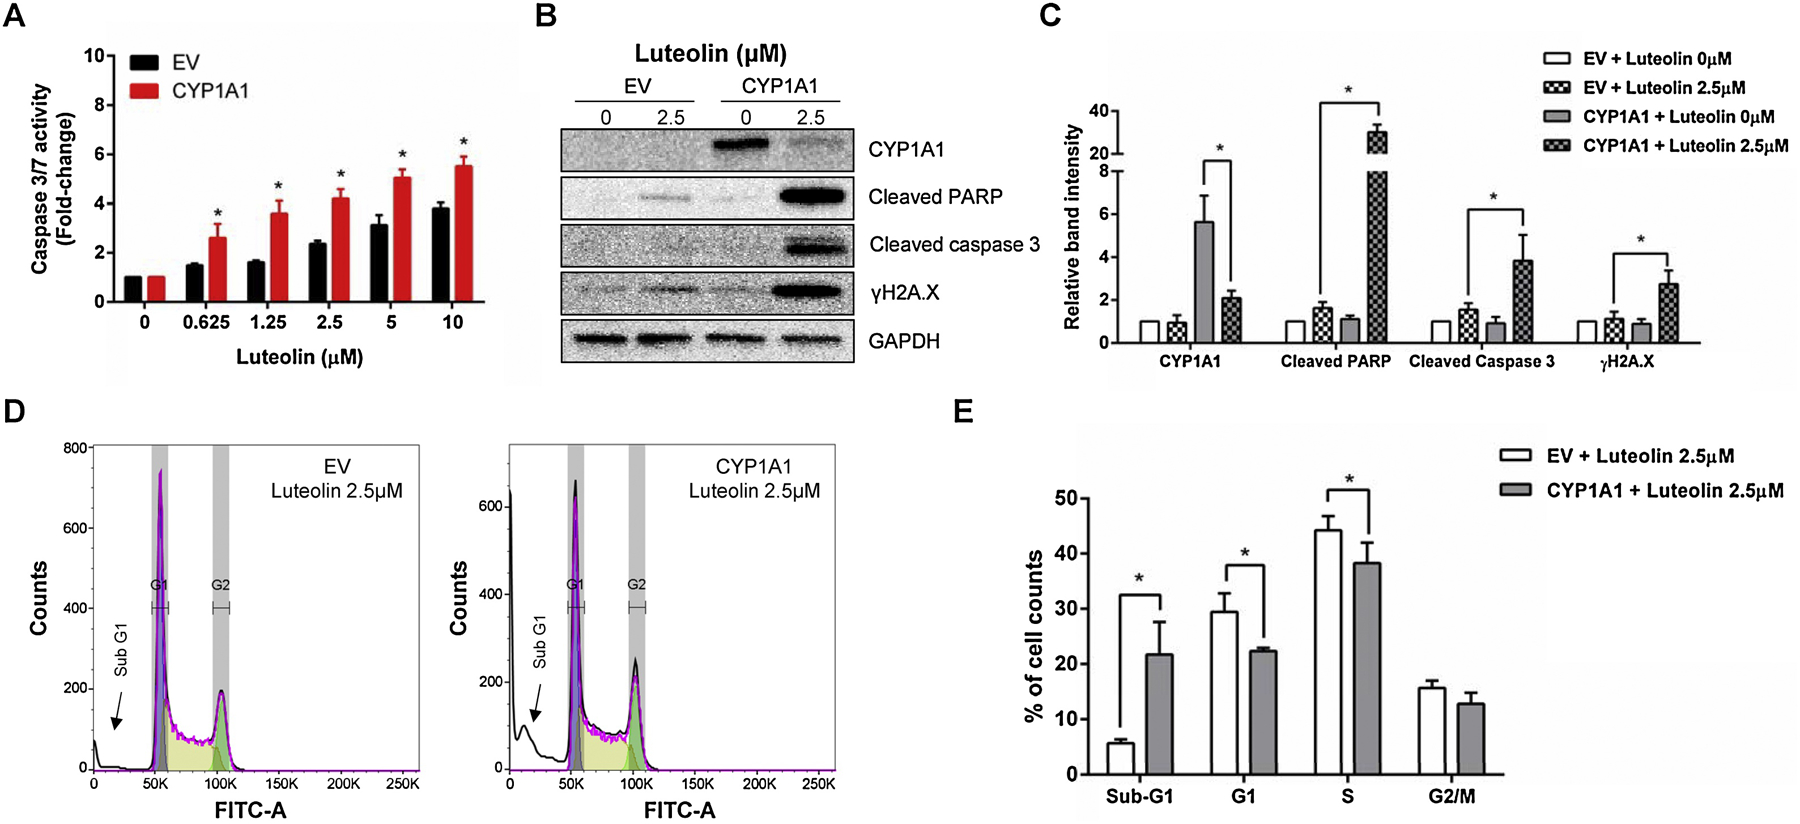
Cells were treated with the indicated concentrations for 24 h. (A) Histogram shows the caspase 3/7 enzymatic activity comparing the CYP1A1-expressing cells to their EV controls. (B & C) Western blot shows the protein expression of CYP1A1, cleaved PARP-1, cleaved caspase 3, and γH2A.X in treated cells (B); all proteins were quantified and normalized to the amount of GAPDH (C). (D & E) Representative flow cytometry plots are shown from one experiment (D) and histogram is cell cycle changes comparing the CYP1A1-expressing cells to their EV controls. The data represent the mean ± SD from three independent experiments (A, C, & E). * indicates P < 0.05 comparing the CYP1A1-expressing cell line versus their corresponding EV controls at the same concentration.