
Figure 8. Quantification of luteolin and diosmetin in the cell culture medium of different TK6 cell lines.
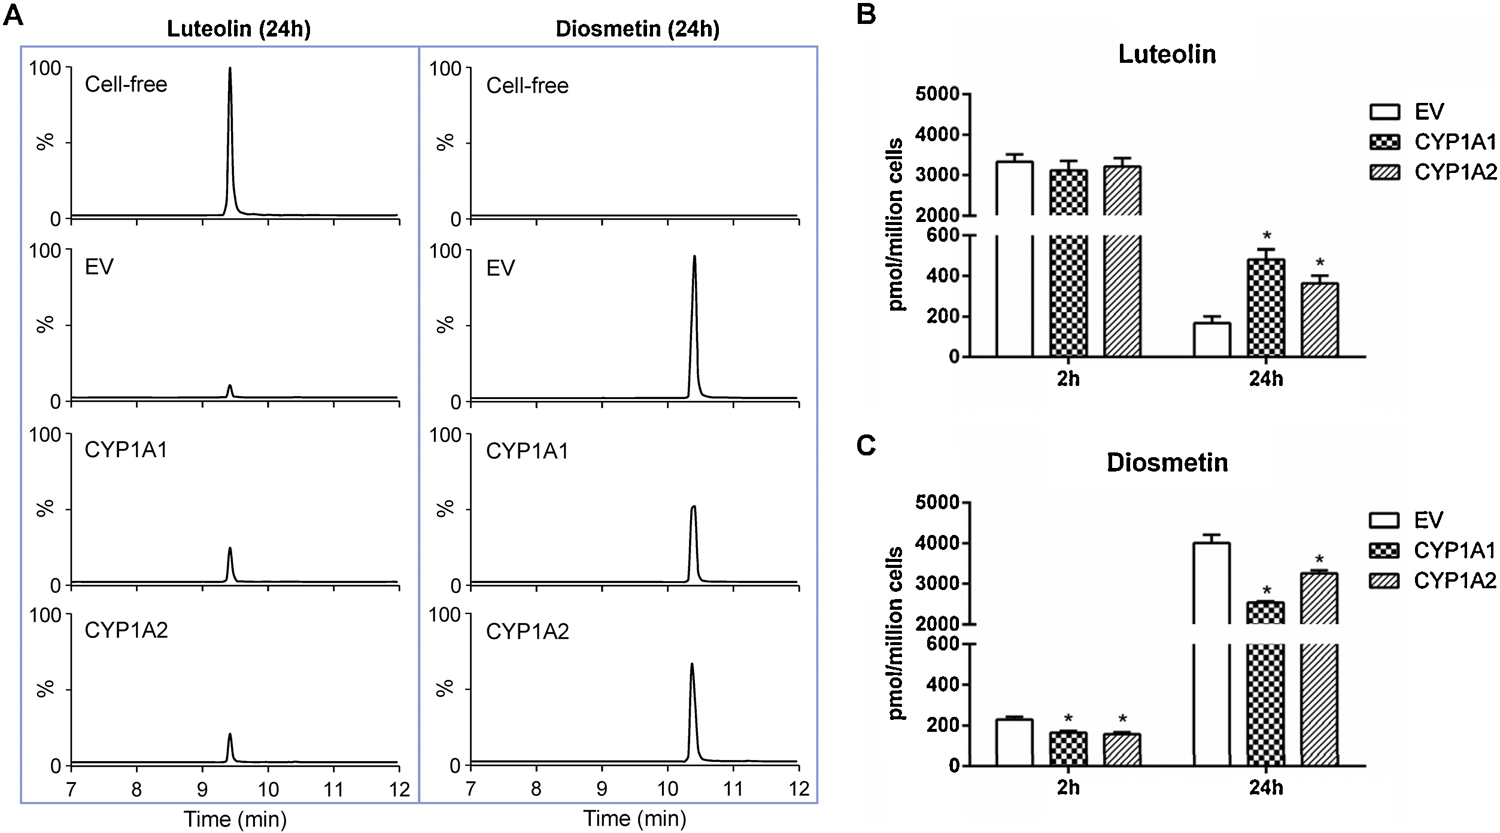
Cells were treated with 2.5 µM luteolin for 2 and 24 h. (A) Representative LC-MS/MS chromatograms show the biotransformation of luteolin to diosmetin after 24-h treatment in the cell-free medium and the cell culture medium of different TK6 cell lines. The amount of luteolin (B) and diosmetin (C) in the cell culture media were quantified after 2- and 24-h treatments. The data represent the mean ± SD from three independent experiments (B & C). * indicates P < 0.05 comparing a CYP-expressing cell line versus the EV controls at the same concentration.