
Fig. 2.
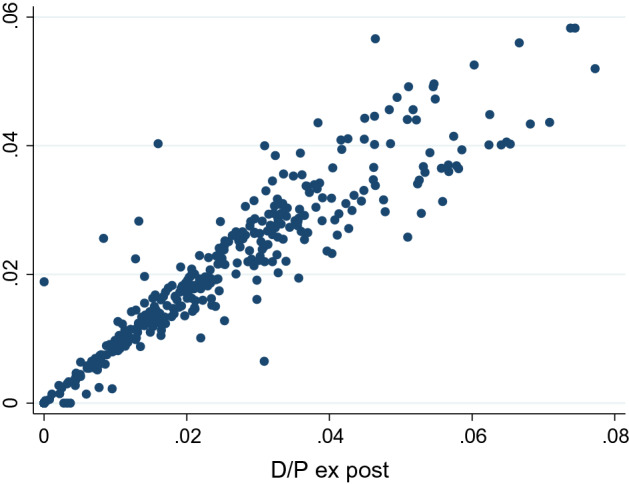
Ex ante and ex post dividend yield (D/P). It shows the ex ante (vertical axis) and ex post (horizontal axis) relationship of the dividend yield (D/P) as observed from December, 2019, through April 30, 2020, for 405 stocks during the COVID-19 crisis