Figure 4.
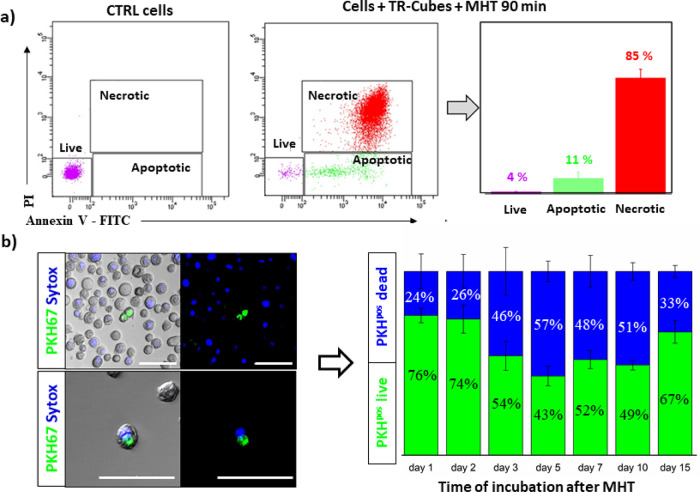
TR-Cubes MHT damage on patient CR-CSCs #21 and more specifically on qCR-CSCs #21. (a) Flow cytometry analysis of annexin V–FITC and PI staining was used to evaluate the cell viability following MHT treatment (f = 182 kHz reaching a fixed temperature of 45 °C for 90 min). Triplicates from the control nontreated cells and the cells exposed to MHT for 90 min were measured. The purple population in the dot plot represents live cells; green, the apoptotic fraction; and red, the dead PI-stained cells. (b) PKHpos cell death estimation based on confocal microscope analysis using Sytox blue staining, specific for dead cells. Left panel, images acquired by confocal microscopy: the green signal represents PKHpos cells, the blue signal represents dead cells, and colocalized green and blue represent dead PKHpos cells. Right panel, cumulative representation of live (green) vs dead (blue) PKHpos cell quantified from the acquired confocal images. At least 500 PKHpos cells were counted per each time point in n = 3 independent experiments. The mean data are reported, and error bars represent SD. Scale bar of 50 μm.

