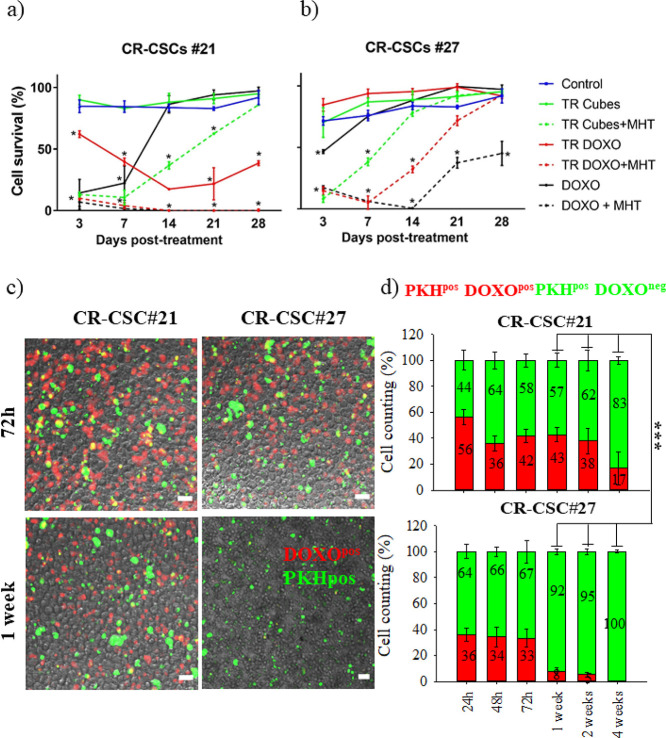
Figure 6.
Cytotoxic effects on qCR-CSCs. Comparative cytotoxic study on DOXO-sensitive (CR-CSC #21, a) and DOXO-resistant (CR-CSC #27, b) patient cells from 24 h up to 1 month post-MHT treatment. Experimental conditions: control (not treated cells), DOXO (DOXO amount of 15 μg), TR-Cubes (cells treated only with TR-Cubes), TR-Cubes + MHT (MHT of three cycles of 30 min each at 182 kHz and 21.68 kA/m), TR-DOXO (cells treated with TR-DOXO), TR-DOXO + MHT (cells treated with TR-DOXO and exposed to MHT), and DOXO + MHT (cells treated with DOXO alone at an amount of 15 μg and exposed to MHT). Statistical analysis was done using ANOVA followed by Dunnett’s multiple comparison test. The statistical difference was calculated for each sample in each time point in comparison to the control at that same time point. The significant decrease in cell survival is annotated as * for p < 0.001. (c) Representative confocal pictures of CR-CSC #21 and CR-CSC #27 after 72 h and 1 week of TR-DOXO treatment showing the almost total absence of DOXO drug (red signal) inside the CR-CSC #27 line after 1 week. This is not the case for DOXO-sensitive CR-CSC #21. Green signal: PKHpos cells. Scale bar: 50 μm. (d) Statistical estimation of PKHpos DOXOpos cells for CR-CSC #21 and CR-CSC #27 from 24 h until 1 month after DOXO treatment based on the images acquired. At least 500 PKHpos cells were counted per each time point and per each experimental condition.***p < 0.001 when comparing qCR-CSC #21 DOXOpos cells vs qCR-CSC #27 DOXOpos cells at 1, 2, and 4 weeks, respectively; ANOVA test.

