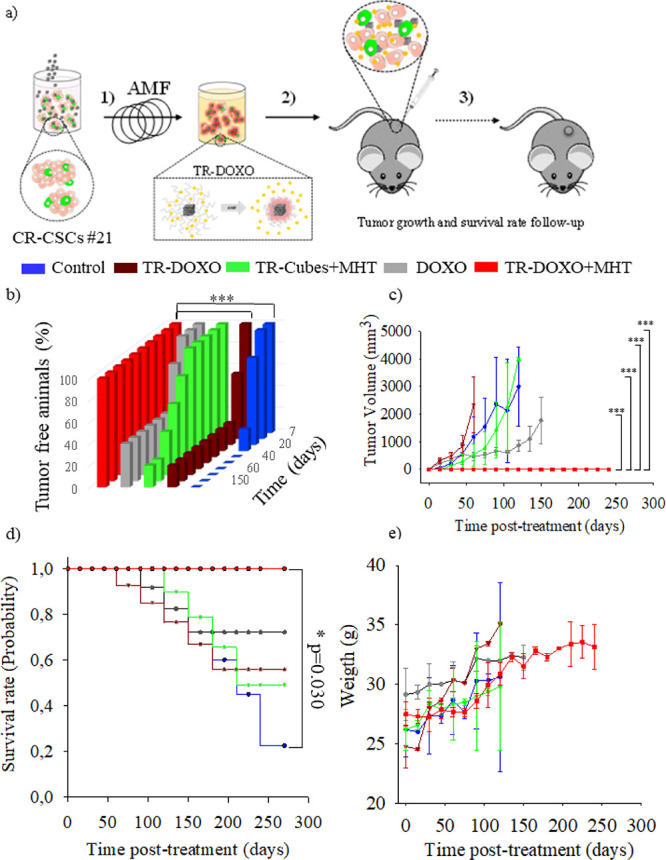
Figure 8.

In vivo monitoring of tumor initiation and relapse capacity of CR-CSCs #21 after in vitro pretreatment with MHT using TR-Cubes or TR-DOXO nanoplatforms. (a) Scheme of the in vivo experiment steps. CR-CSC #21 cells subjected to administration of TR-DOXO or TR-Cubes with or without the MHT exposure (182 kHz for three cycles of MHT of 30 min each) were injected subcutaneously on the flank of NMRI nude mice (1 × 10⁶ live cells per animal). A follow-up of the animals was prolonged up to 8 months. A tumor of 2 cm in at least one of its side marked the end point of the experiment.(b) Percentage of tumor-free animals over time (8 months of experiment). * **p < 0.001 control vs TR-DOXO + MHT and ***p < 0.001 TR-DOXO vs TR-DOXO + MHT for days 120, 155, and 180, respectively; ANOVA and Tukey post hoc test. (c) Tumor growth curves (tumor volume: mm3) for animals injected with CR-CSC #21 cells (control, not treated) or cells previously treated with TR-Cubes + MHT, TR-DOXO, or free DOXO or TR-DOXO + MHT cells. ANOVA and Dunn post hoc test. Statistical analysis shows statistical differences, ***p < 0.001, on the experimental groups: control vs TR-DOXO + MHT, TR-Cubes + MHT vs TR-DOXO + MHT, DOXO vs TR-DOXO + MHT, and TR-DOXO vs TR- DOXO + MHT for days 45, 60, 75, 90, 105, and 120, respectively. (d) Kaplan–Meier survival plot showing the difference in tumor suppression and improved survival between the TR-DOXO + MHT and the other groups studied up to 8 months; *p = 0.030; p value is calculated with the log-rank test. (e) Weight graphs of animals in control (no treated), DOXO, TR-DOXO, TR-Cubes + MHT, and TR-DOXO + MHT groups showing no weight loss for the 8 months of experiment. For graphs in panels (b), (c), (d), and (e), data shown are mean ± SD, with n = 6 of two independent experiments.
