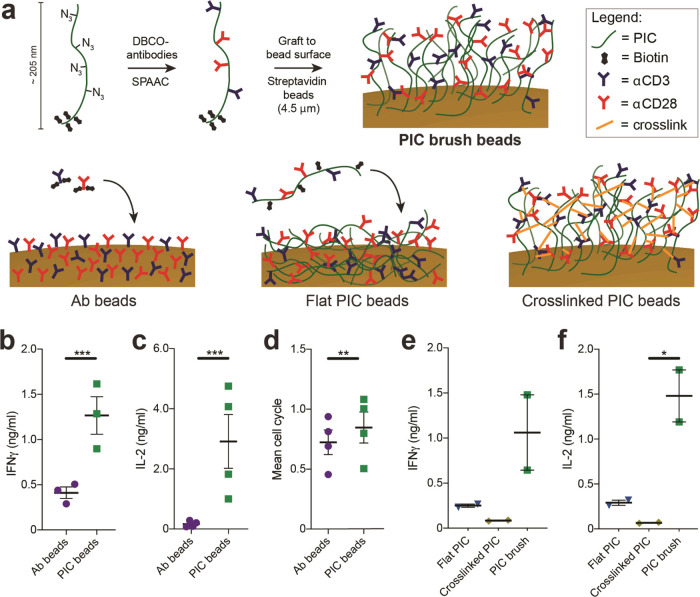
Figure 1.
Synthesis and characterization of PIC immunobrush beads. (a) Schematic overview of the preparation of PIC brush beads (top), Ab beads (bottom left), flat PIC beads (bottom center), and cross-linked PIC beads (bottom right). (b, c) Production of IFNγ (b, n = 3 in two independent experiments) and IL-2 (c, n = 4 in two independent experiments) after 20–24 h of human T cells stimulated with directly coupled antibody beads or PIC beads. (d) Mean cell cycle of proliferated human T cells on day 3, stimulated directly coupled antibody beads or PIC beads n = 4 in two independent experiments. (b–d) A paired t test was performed on log2-transformed data. (e, f) IFNγ and IL-2 production of human T cells after 20–24 h stimulated with PIC beads with reduced mobility, n = 2 in one independent experiment. An RM one-way analysis of variance (ANOVA) was performed on log2-transformed data with Geisser–Greenhouse correction, followed by Dunnett’s multiple comparison test.

