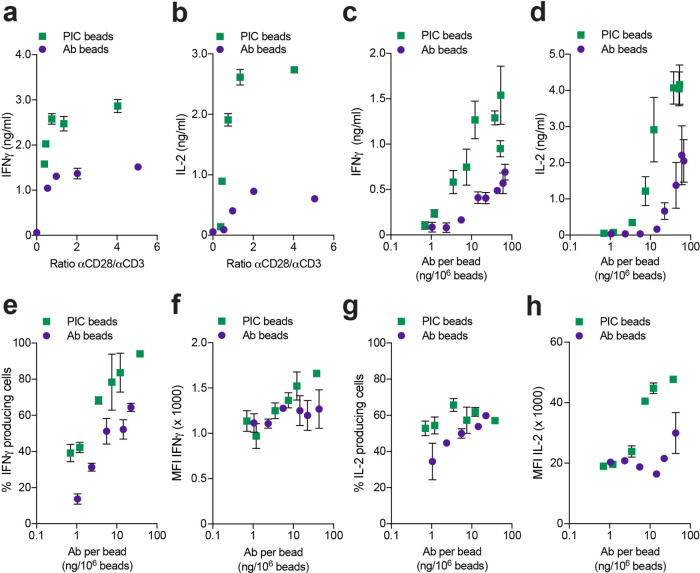
Figure 2.
Influence of αCD28/αCD3 ratio and density. (a, b) IFNγ and IL-2 concentrations in the supernatant of T cells stimulated with Ab or PIC beads with different αCD28/αCD3 ratios after 24 h of culture n = 3 in two independent experiments. (c, d) IFNγ and IL-2 concentrations in the supernatant of T cells stimulated with Ab or PIC beads with different total antibody densities after 24 h of culture n = 4 and 3, respectively, in two independent experiments. (e) Percentage of IFNγ producing T cells after 7 days of culture with Ab or PIC beads over a full range of antibody densities. (f) Mean fluorescence intensities (MFI) of IFNγ produced by T cells after 7 days of culture with Ab or PIC beads over a full range of antibody densities. (g) Percentage of IL-2 producing T cells after 7 days of culture with Ab or PIC beads over a full range of antibody densities. (h) Mean fluorescent intensities (MFI) of IL-2 produced by T cells after 7 days of culture with Ab or PIC beads over a full range of antibody densities n = 2 in one independent experiment for (e)–(h).

