Figure 4.
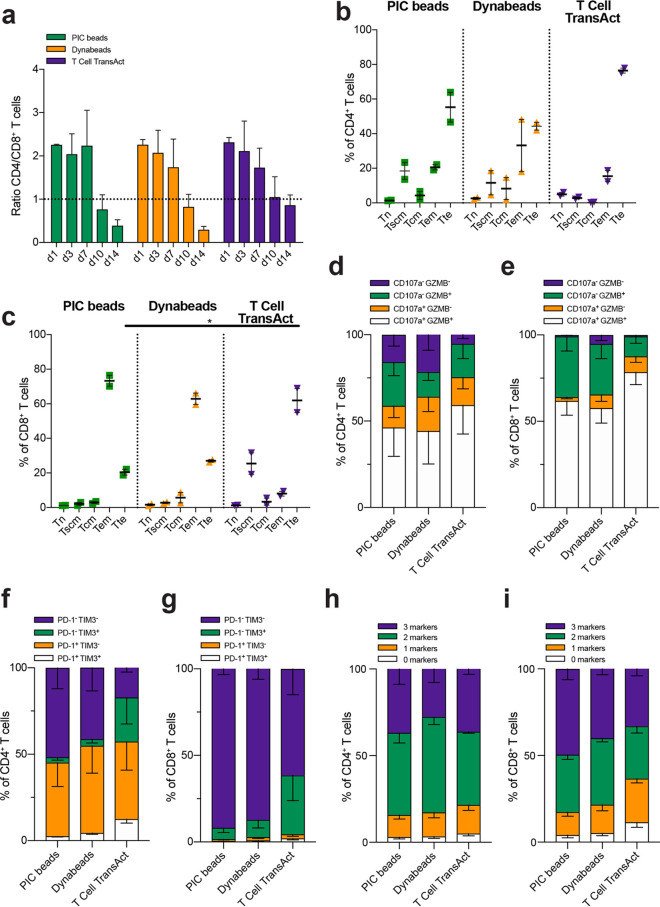
Phenotype and function of human T cells expanded with PIC immunobrush beads on day 14. (a) Ratio of CD4+–CD8+ human T cells after expansion n = 2–5 in one or two independent experiments. Data were analyzed using a mixed-effects model, followed by a Dunnett’s multiple-comparisons test on log2-transformed data. (b, c) CD4+ and CD8+ differentiation of human T cells in to different memory subsets after expansion with PIC beads, Dynabeads, or T Cell TransAct, respectively; n = 2 in one independent experiment. (d) CD4+ and (e) CD8+ cytotoxic character of human T cells after expansion; n = 5 in two independent experiments. Statistics: CD4+ T cells: CD107–GZMB+ PIC beads vs Dynabeads p < 0.05. CD8+ T cells: CD107–GZMB– PIC beads vs Dynabeads p < 0.05, CD107–GZMB+ PIC beads vs T cell Transact p < 0.01, CD107+GZMB+ PIC beads vs T cell Transact p < 0.05. (f, g) CD4+ and CD8+ exhaustion character of human T cells after expansion, respectively; n = 5 in two independent experiments. Statistics: CD4+ T cells: PD-1–TIM3– PIC beads vs T cell Transact p < 0.01, PD-1–TIM3+ PIC beads vs T cell Transact p < 0.05, PD-1+TIM-3+ PIC vs T cell Transact p < 0.01. CD8+ T cells: PD-1–TIM3+ PIC beads vs T cell Transact p < 0.01, PD-1+TIM3+ PIC vs T cell Transact p < 0.01. (h, i) Intracellular expression of 0, 1, 2, or 3 cytokines (IL-2, IFNγ and/or TNFα) in CD4+ (h) and CD8+ (i) T cell; n = 5 in two independent experiments. Statistics: CD4+ T cells: three markers PIC vs Dynabeads p < 0.05. CD8+ T cells: 1 marker PIC vs T cell Transact p < 0.05, 0 markers PIC vs T cell Transact p < 0.05. (b–i) Significance was analyzed with an RM two-way ANOVA with Geisser–Greenhouse correction, followed by Dunnett’s multiple-comparisons test.

