Figure 8.

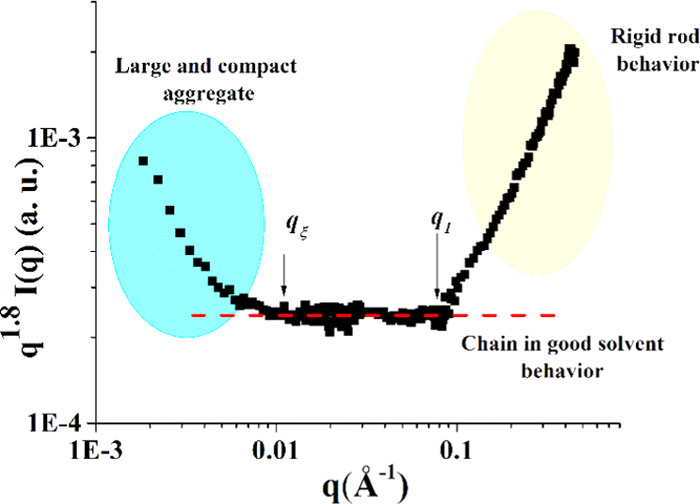
Representation of the SANS data: q1.8I(q) vs q representation. The onsets in q of the different behaviors are discussed in the text.

Representation of the SANS data: q1.8I(q) vs q representation. The onsets in q of the different behaviors are discussed in the text.