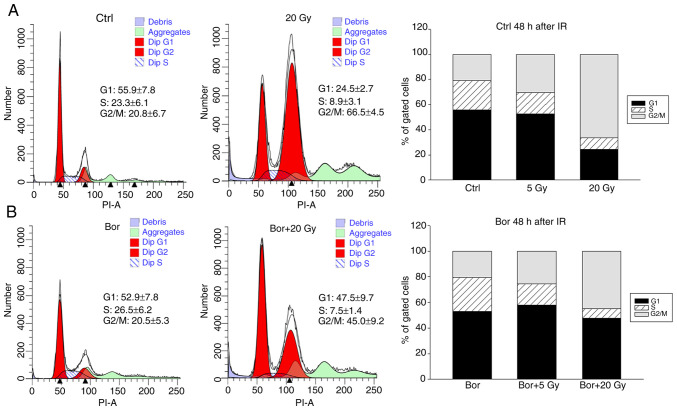
Figure 2.
Effects of bortezomib and IR on the cell cycle distribution. (A and B) Representative flow cytometry cell cycle measurements (A) at 48 h post-IR exposure and (B) following co-treatment with bortezomib. Cell populations in the G0/G1, S and G2/M phases are presented as the mean percentage of total cells (n=5). IR caused a decrease in the number of cells in G1 (black) and S (dashed) phase, which was accompanied by a pronounced increase of cells in G2/M phase (grey) (n=5). IR, ionizing radiation; Ctrl, control; Bor, bortezomib.

