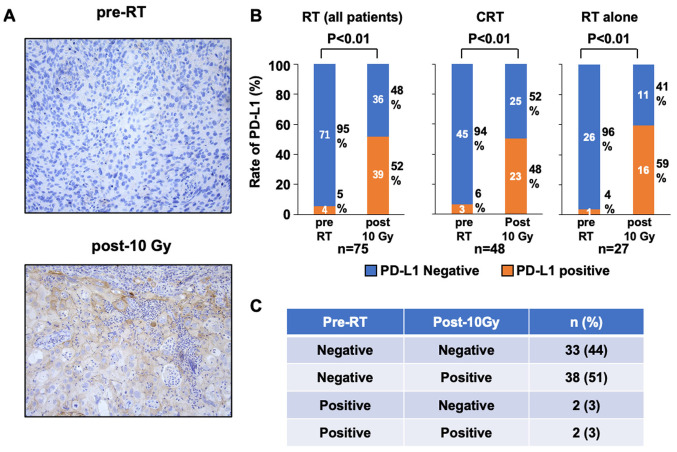
Figure 2.
PD-L1 staining and alterations in PD-L1 expression on tumor cells induced by CRT/RT. (A) Representative images of immunohistochemical PD-L1 staining pre-RT (negative) and post-10 Gy (positive) from the same patient (magnification, ×400). (B) PD-L1 expression was upregulated by RT (all patients), CRT and RT alone. The number within the bar represents the number of patients. The percentage is displayed next to the bar graph. (C) Summary of PD-L1 status pre-RT and post-10 Gy in all patients. PD-L1, programmed death-ligand 1; RT, radiotherapy; CRT, chemoradiotherapy.

