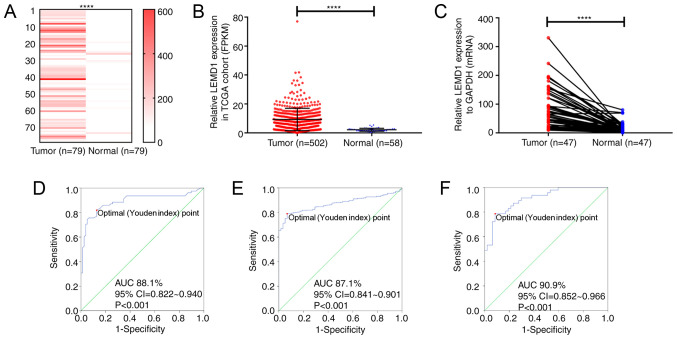
Figure 1.
LEMD1 expression in TC tissues is upregulated compared with that in normal thyroid tissues. LEMD1 expression was significantly upregulated in the tumor tissues of (A) the RNA-seq cohort (Wilcoxon test), (B) TCGA dataset (Mann-Whitney test) and (C) the local validated cohort (Wilcoxon test). Receiver operating characteristic curve analysis of LEMD1 expression was used to identify TC tissues from normal thyroid tissues in (D) the RNA-seq cohort (sensitivity and specificity values were 81.0 and 87.3, respectively), (E) TCGA dataset (sensitivity and specificity values were 79.1 and 93.1, respectively) and (F) the local validated cohort (sensitivity and specificity values were 78.7 and 91.5, respectively). The optimal cut-off value of LEMD1 expression was determined by maximizing the Youden index value. Youden index=(sensitivity + specificity)-1. Data are shown as the mean ± SD of three independent experiments. ****P<0.0001. LEMD1, LEM domain containing 1; TC, thyroid cancer; TGCA, The Cancer Genome Atlas; FPKM, fragments per kilobase per million; AUC, area under curve.

