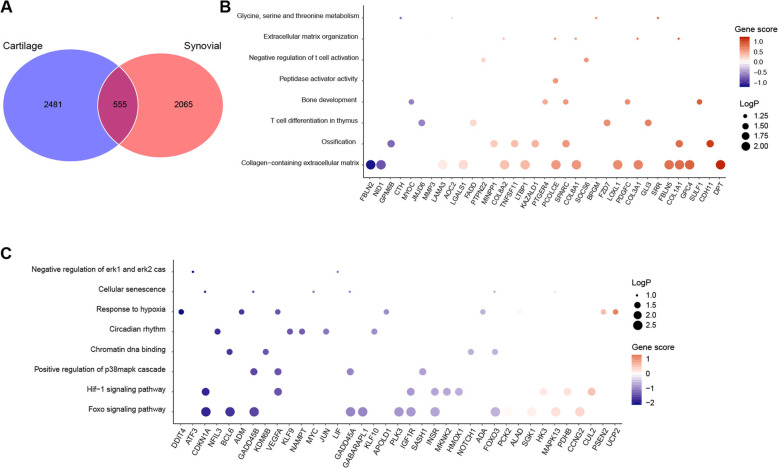
Fig. 3.
Gene ontology analysis of common DEGs from synovial and cartilage tissues. a Venn plot of DEGs from synovial and cartilage transcriptome datasets. b Gene ontology analysis of genes that were upregulated in both synovial and cartilage transcriptome datasets comparing OA with normal. “MAGeCKFlute” R package was applied to perform the enrichment analysis. c Gene ontology analysis of genes that were downregulated in both synovial and cartilage transcriptome datasets comparing OA with normal. “MAGeCKFlute” R package was applied to perform the enrichment analysis

