
Figure 3.
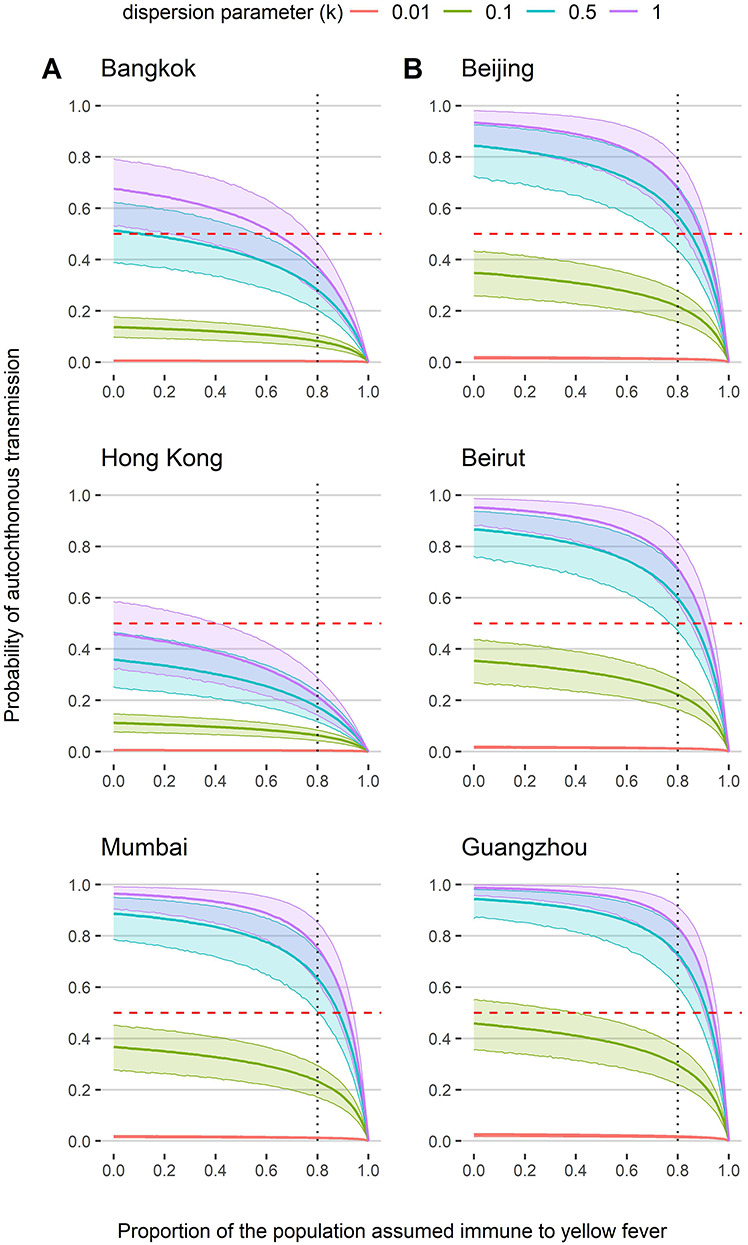
Probability of autochthonous transmission across increasing levels of population immunity at (A) the average temperature in Bangkok, Hong Kong and Mumbai assuming transmission by A. aegypti and (B) the maximum temperature in Beijing, Beirut and Guangzhou assuming transmission by A. albopictus. Also presented are probabilities at different values of the dispersion parameter k, where purple = 1, blue = 0.5, green = 0.1(baseline value) and red = 0.01. Thick lines are the mean and shaded areas are the 95% CIs. Horizontal dashed red line represents the point at which the probability of autochthonous transmission is <0.5. Vertical dashed line denotes 80% population immunity recommended by the WHO to stop local transmission in endemic countries