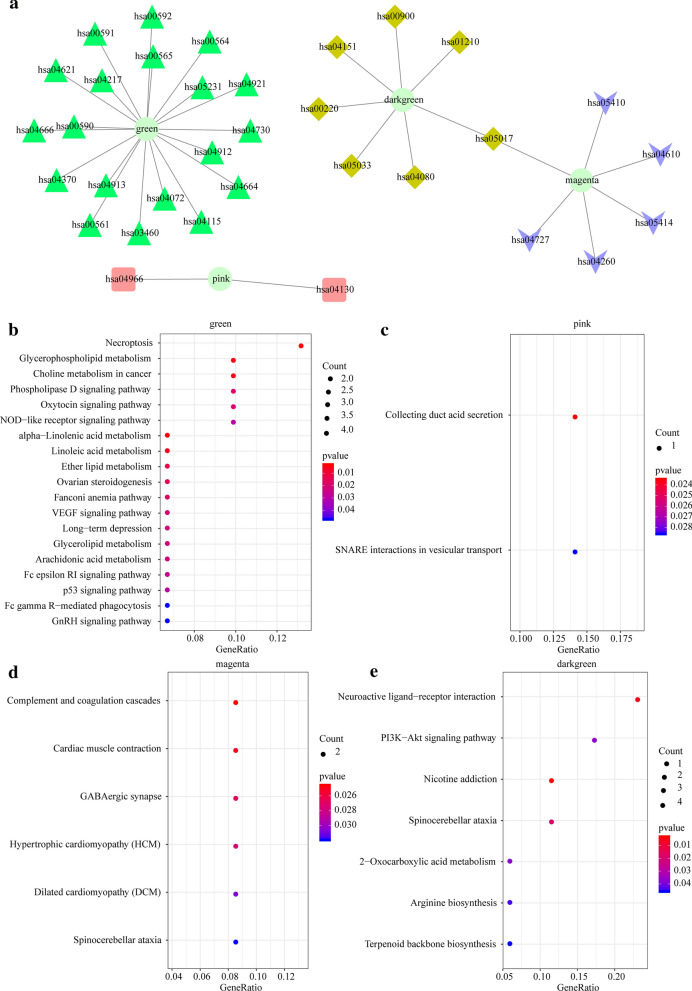
Fig. 4.
KEGG enrichment analysis of four lncRNA enrichment modules. a Network relationship of enrichment results of the four modules (green, pink, magenta and darkgreen). b Enrichment results of gene KEGG in green module. c KEGG enrichment results of genes in pink module. d KEGG enrichment results of genes in magenta module. e KEGG enrichment results of genes in darkgreen module. The color from red to blue represents the p value from large to small, the size of the circle represents the number of genes in the enrichment pathway, with a larger circle representing more gene data

