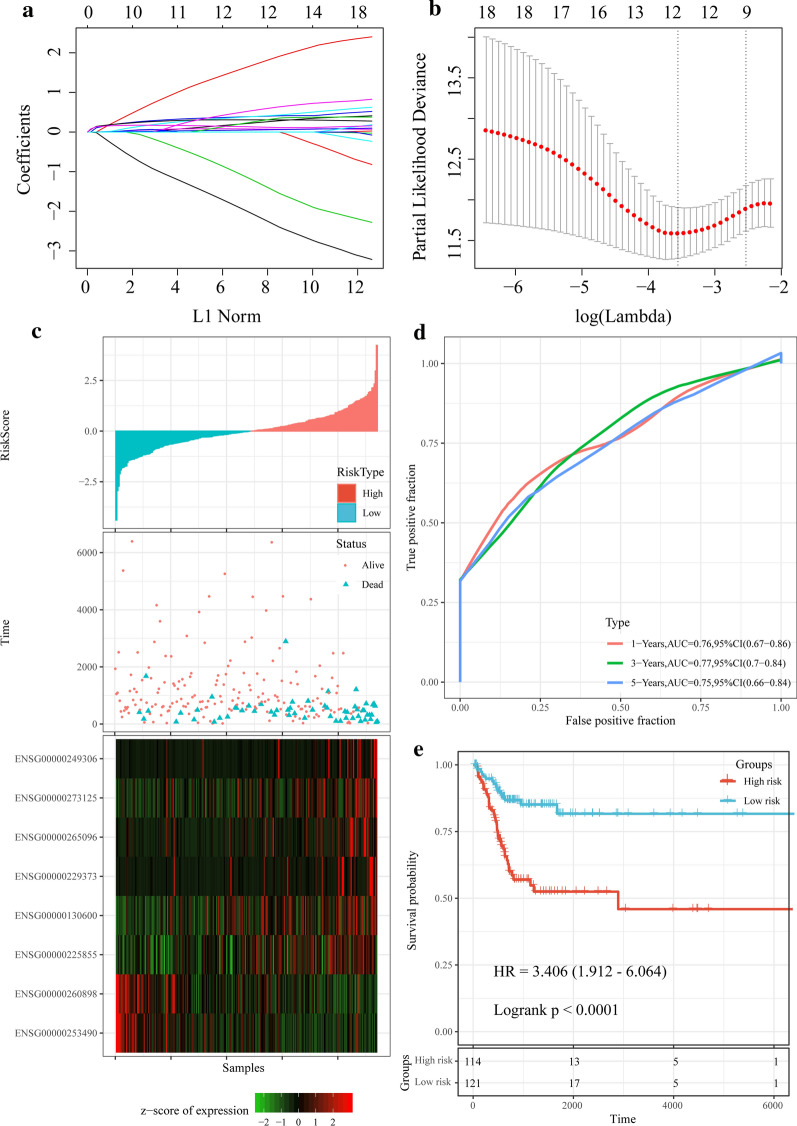
Fig. 6.
Screening of lncRNA prognostic markers and establishment of prognostic models. a The number of genes is increasing as lambda increases, the horizontal axis represents the log value of the independent variable lambda, and the vertical axis represents the coefficient of the independent variable. b Confidence interval under each lambda. c Risk score, survival time, survival status and expression of the 8-lncRNA signature in the training set. d ROC curve and AUC of the 8-lncRNA signature in training set. e KM survival curve distribution of the 8-lncRNA signature in the training set

