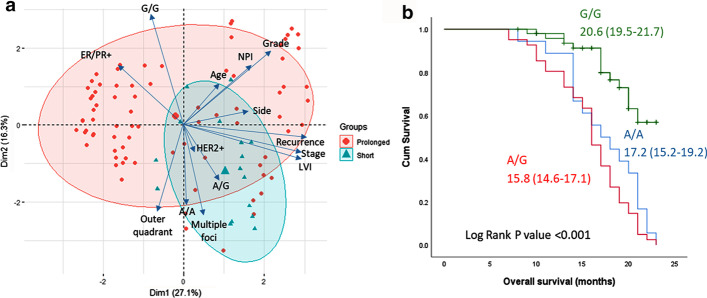
Fig. 4.
Impact of CDKN2B-AS1 variant on survival. a Principal component analysis plots the interactions of variables. Each arrow represents a variable with a longer length indicating a greater impact on distribution of the samples. Each observation is symbolized as a triangle (if it has short overall survival) or circle (if it has prolonged survival). Mortality was associated with A/A and A/G genotypes. They were more likely to have ER/PR− and HER2+ receptors and multiple foci. b Kaplan–Meier curve showing the mean and confidence interval duration of overall survival according to their genotype status. G/G homozygote patients had longer survival than their counterparts (P < 0.001)

