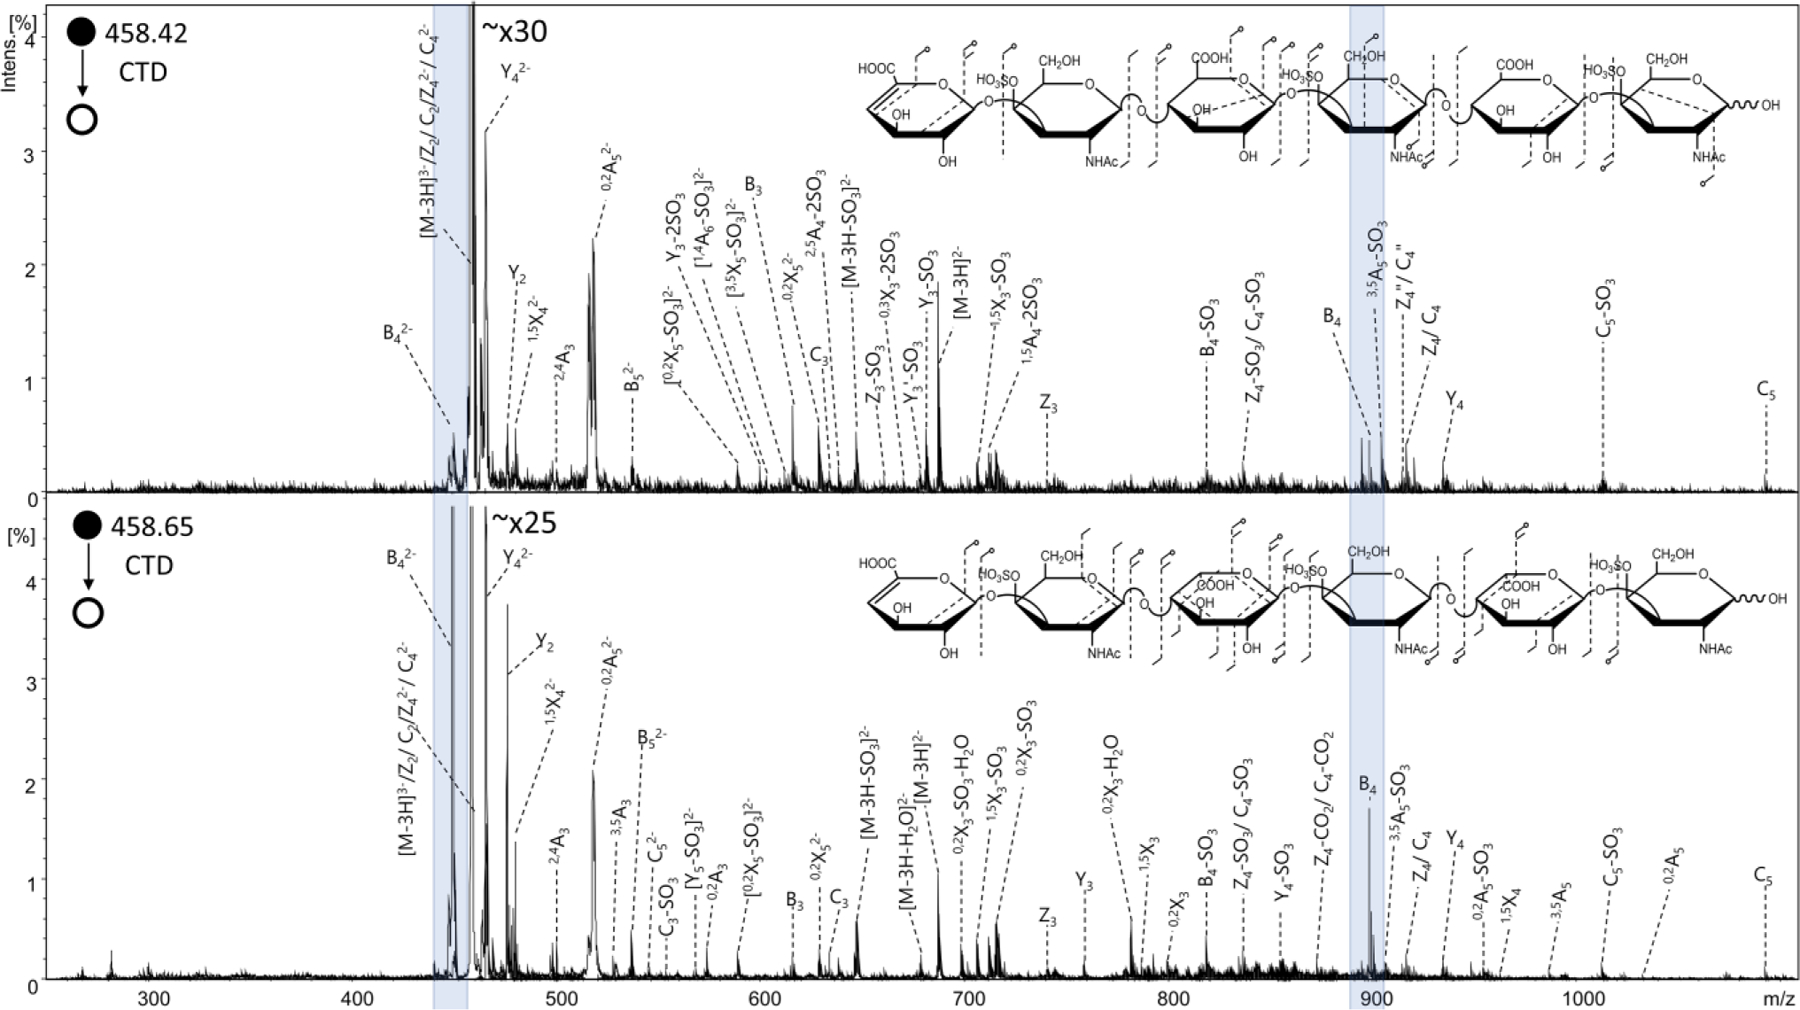
Figure 8.

CTD spectra of the [M-3H]3- precursor of (top) chondroitin sulfate hexamer ΔHexA-GalNAc4S-GlcAA-GalNAc4S-GlcA-GalNAc4S-OH and (bottom) dermatan sulfate hexamer standard ΔHexA-GalNAc4S-IdoA-GalNAc4S-IdoA-GalNAc4S-OH. Molecular structure inset represents fragmentation seen from CTD MS/MS results of chondroitin sulfate (top) and dermatan sulfate (bottom). Blue highlights indicate the B4 fragment ions shown to have a higher intensity for dermatan sulfate than chondroitin sulfate.
