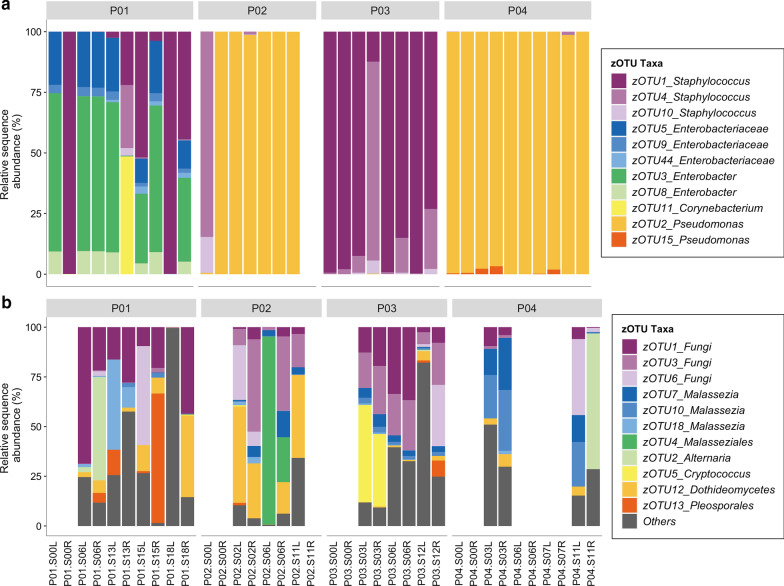
Fig. 1.
Relative sequence abundance taxa plots of the a bacteria and b fungi detected from 16S rRNA bacterial gene and fungal ITS2 amplicon sequencing. All detected zero-radius operational taxonomic units (zOTUs) are shown for bacteria, and the top 11 most abundant fungal zOTUs are shown with all remaining combined in “Others”. Missing bars represent samples that did not pass quality filtering steps during bioinformatic analyses. All patient baseline samples and P04 left and right samples 7 months after baseline were excluded from fungal ITS2 sequencing. P = Patient, L = left middle meatus, R = right middle meatus. Months from baseline samples are shown preceding sample side L/R

