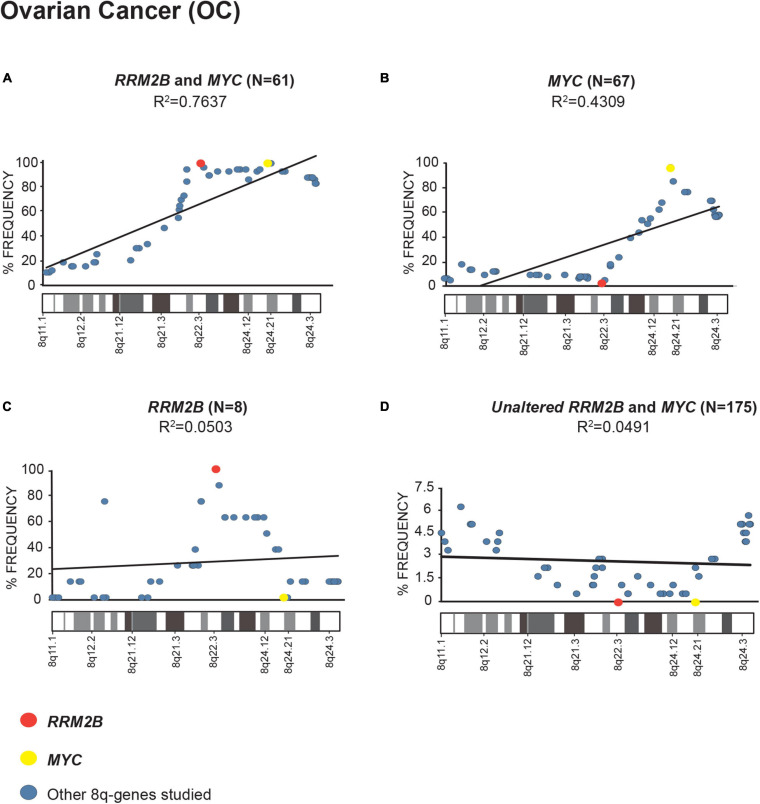
FIGURE 2.
Amplification frequency of 8q-genes in ovarian cancer (OC). (A) cases with co-amplification of RRM2B and MYC; (B) cases MYC only amplification; (C) cases RRM2B only amplifications; (D) cases with neither (unaltered) were plotted as percent of frequency for amplifications in various 8q-region genes relevant for cancer (see Supplementary Table 1). RRM2B (red circle), MYC (yellow circle), and other genes (blue circle). The Pearson correlation (R2 value) for the data points is represented by a black trend line.

