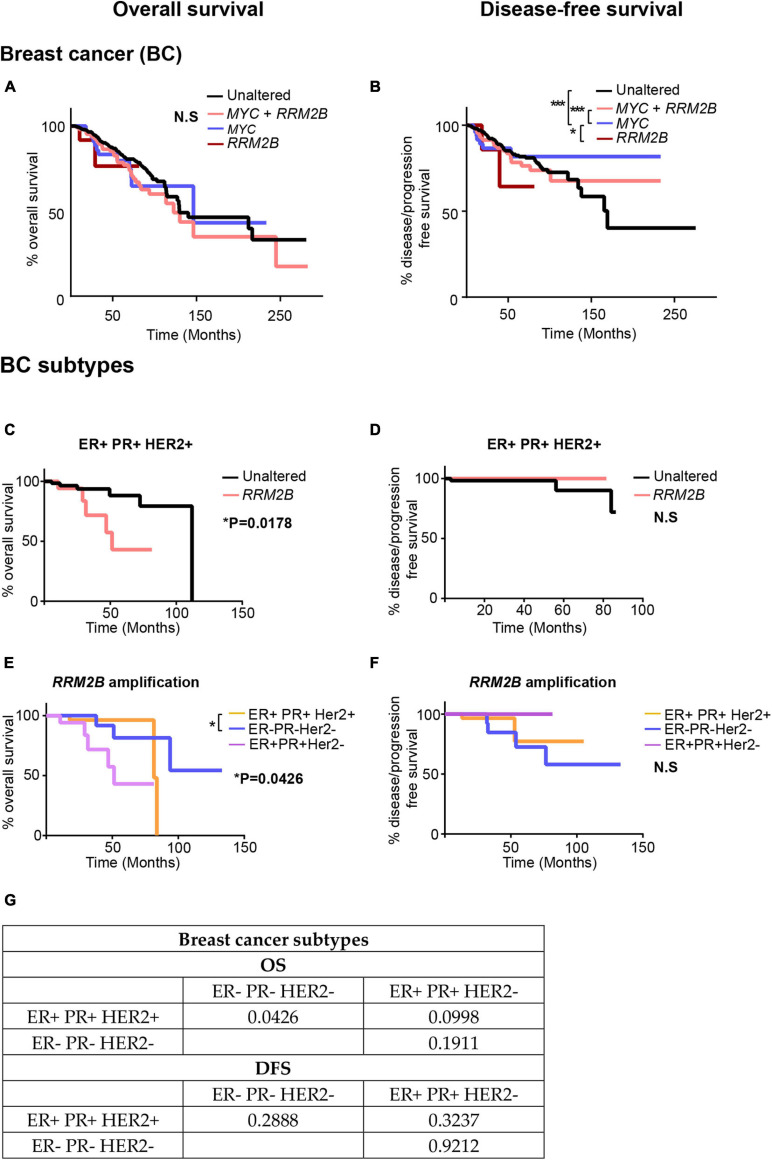
FIGURE 6.
Kaplan-Meier curves for OS and DFS in breast cancer (BC) (A,B) and its subtypes (C–G) studies with RRM2B amplifications and/or MYC amplifications. (A) OS in BC cases. The cases that were unaltered for both genes (black, n = 737), cases with RRM2B amplifications (red, n = 14), cases with MYC amplifications (blue, n = 62) and co-amplifications (pink, n = 210) were plotted. (B) DFS in BC cases. The cases that were unaltered for both genes (black, n = 678), cases with RRM2B amplifications (red, n = 12), cases with MYC amplifications (blue, n = 55) and co-amplifications (pink, n = 184) were plotted. (C) OS in ER + PR + HER2 + BC cases. The cases that were unaltered for RRM2B (black, n = 68), cases with RRM2B amplifications (salmon, n = 18). (D) DFS in ER + PR + HER2 + cases. The cases that were unaltered for RRM2B (black, n = 63), cases with RRM2B amplifications (red, n = 13). (E) OS in BC subtypes with RRM2B amplifications. ER + PR + HER2 + cases with amplifications in RRM2B (purple, n = 18), ER- PR- HER2- cases with amplifications in RRM2B (blue, n = 26), and ER + PR + HER2- cases with amplifications in RRM2B (peach, n = 36). (F) DFS in BC subtypes with RRM2B amplifications. ER + PR + HER2 + cases with amplifications in RRM2B (purple, n = 13), ER- PR- HER2- cases with amplifications in RRM2B (blue, n = 25), and ER + PR + HER2- cases with amplifications in RRM2B (peach, n = 34). The plots were compared using Log-rank test and significance is shown as follows: *P < 0.05, **P < 0.01, and ***P < 0.001. (G) P-values for the graphs (E,F).

