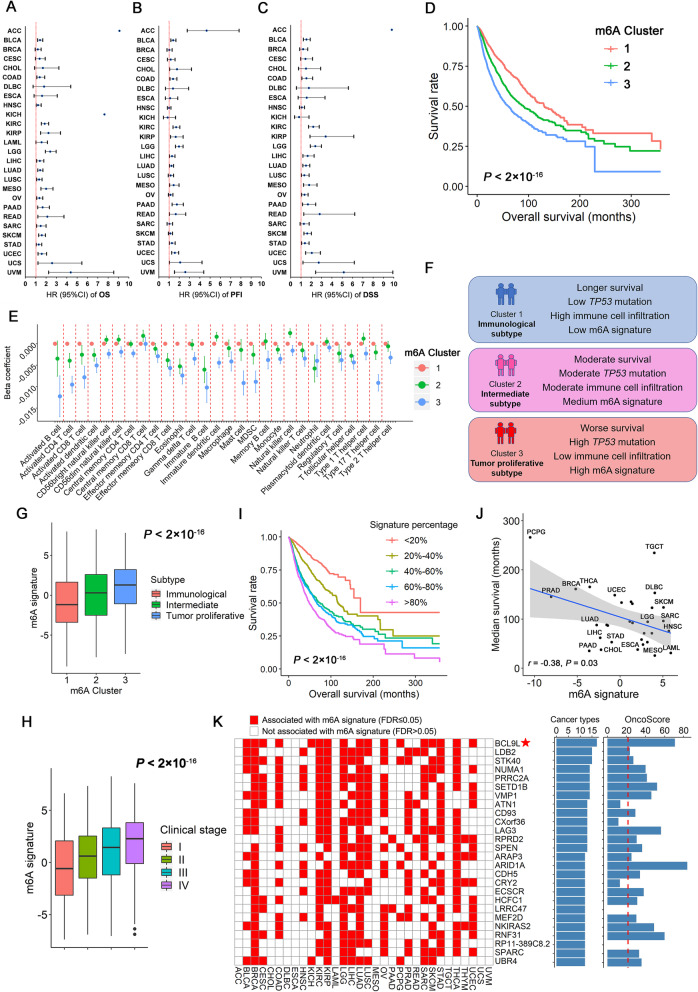
Fig. 2.
a-c Associations of the m6A subtypes and pan-cancer overall survival (OS), Progression-free interval (PFI) and disease-specific survival (DSS). The hazard ratios (HR) are evaluated by the trend association (clusters 1–3) in the Cox proportional hazard models. d Kaplan-Meier plots of the m6A subtypes and overall survival. e Associations between m6A subtypes and the ssGSEA scores of tumor microenvironment cell infiltration. Cluster 1 is used as a reference group. f Summary of the characteristics of different m6A subtypes. g Correlation of the m6A signature and m6A subtypes. h Distributions of the m6A signature across different clinical stage (I-IV). i Kaplan-Meier plot of the m6A signature and overall survival. We categorized the signature into five subgroups with equal sample sizes and adjusted the curves with age, gender, stage, cancer types and probable estimations of expression residual (PEER) factors. j Correlation plot of the m6A signature and median survival time (MST) of each cancer type. k The top potential m6A targets associated with the m6A signature in ≥12 cancer types. We used the OncoScore system to evaluate their relationships with cancer based on previous literature reports

