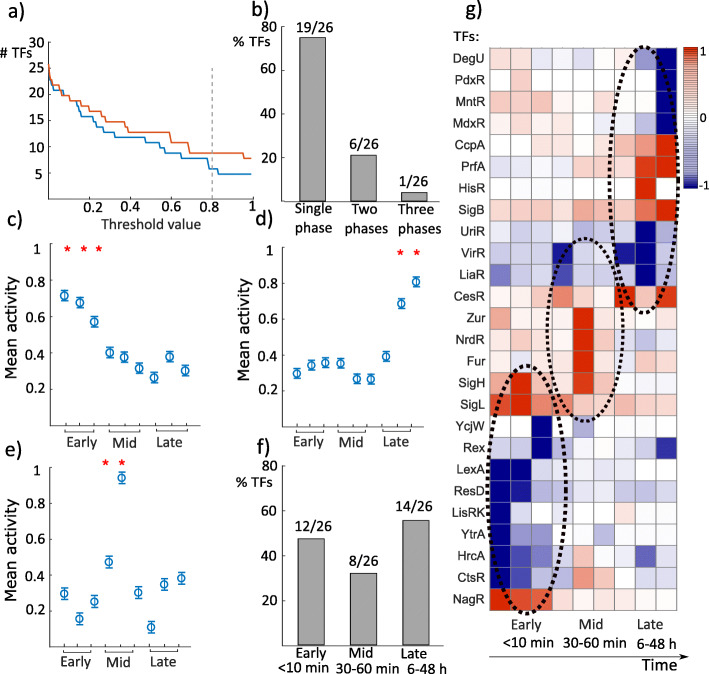
Fig. 2.
TFs operate in three distinctive phases. a We set a threshold that defines whether a TF activity was regulated due to the exposure to high pressure at a time point to 0.8 (80% of maximum), the lowest stable value (see “Data analysis” section). Here only time point 0 (blue) and time point 48 h (red) are shown. b 73% of the TFs (19/26) were regulated in activity only during a single phase: either during the first 10 min (early), between 30-60 min (mid), or after 6 h (late) following HPP. 23% of the TFs (6/26) were activity-regulated during two phases, and only one TF activity was regulated for the whole duration of the experiment. c-e The mean values for activity during the first time points (0, 5, 10 min) were significantly different (ANOVA, F(8,90)=7.15,p=2.7×10⁻⁷) from the remaining time points for the early-phase group. The mean values for TF activity during the last time points (24 and 48 h) were significantly different (ANOVA F(8,126)=5.81,p=2.61×10⁻⁶) from the remaining time points for the late-phase group. For the TFs that were exclusively activity-regulated in the mid-phase, the mean value for TF activity was significantly different (ANOVA, F(8,2691)=331.89,p=0) from the other time points. In parts c, d, and e, the y-axis represents the absolute value of the mean value for TF activity. f 46% of the TFs (12/26) were activity-regulated within the first 10 min after pressure stress, 31% (8/26) during the second phase, and 54% (14/26) in the last phase. g The TFs which belonged to the three separate phases are depicted in the temporal activity map (blue for repression and red for activation): early (0, 5, and 10 min), mid (30, 45, and 60 min), and late (6, 24, and 48 h) after HPP

