Fig. 7.
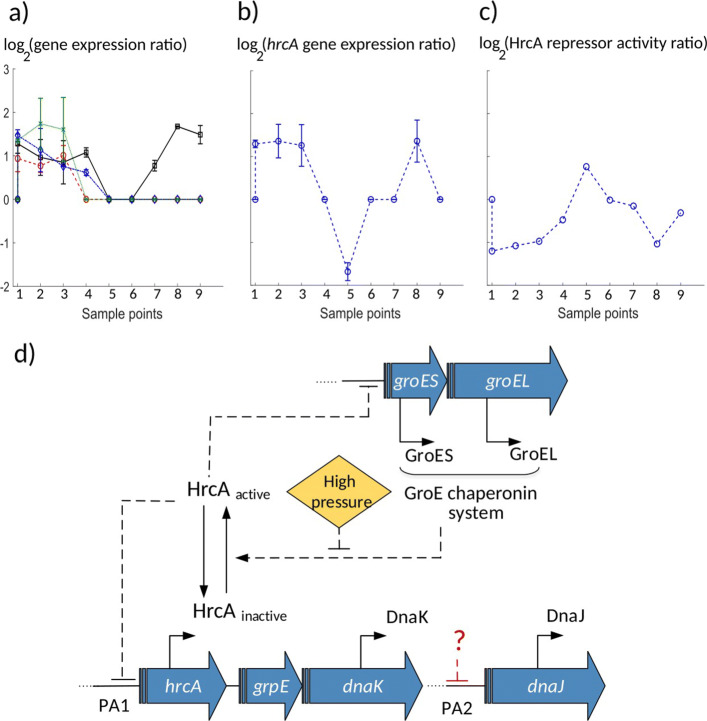
The HrcA-chaperones GRN. a Expression levels (log(mRNAHPP(t)/mRNActrl(t))) for the chaperonin genes dnaJ (red ’o’ marks and dashed line), dnaK (black square marks and solid line), groEL (green ’x’ marks and dotted line), and groES (blue diamond marks and dashedotted line) in L. monocytogenes were elevated during the first 10 min (sample points 1-3) after HPP, then suppressed to their original levels, except the dnaK, which was highly expressed during the later time. To make early time points distinguishable, the x-axis represents sample points for 9 time points (1-9) corresponding to 0, 5, 10, 30, 45, 60 min and 6, 24, 48 h, respectively. Error bars show the standard deviation of the three experimental replicates from the average value. b Expression level of the hrcA gene was high during the first 10 min (sample points 1-3) after pressure, followed by a suppression around 45 min (sample point 5), and elevated again during the late time (sample point 8). The x-axis is the same as part a. Error bars show the standard deviation of the three experimental replicates from the average value. In part a and b, at several time points, the p value for the fold change was higher than 0.05 (the adjusted threshold for differentially expressed genes), and therefore we set the expression ratio at those points to zero without error bars. c Activity of the regulator HrcA (log(TFAHPP(t)/TFActrl(t)) calculated by the NCA algorithm) was suppressed during the early-phase, then activated during the mid-phase, followed by another suppression at the late-phase. The x-axis is the same as part a. d A schematic illustration for the HrcA-chaperones GRN. Since according to part b the gene expression ratio for hrcA increased or remained unchanged (and not decayed) over almost all time points, the pressure effect might make HrcA not degraded but inactive that can be a reversible reaction

