Fig. 5.
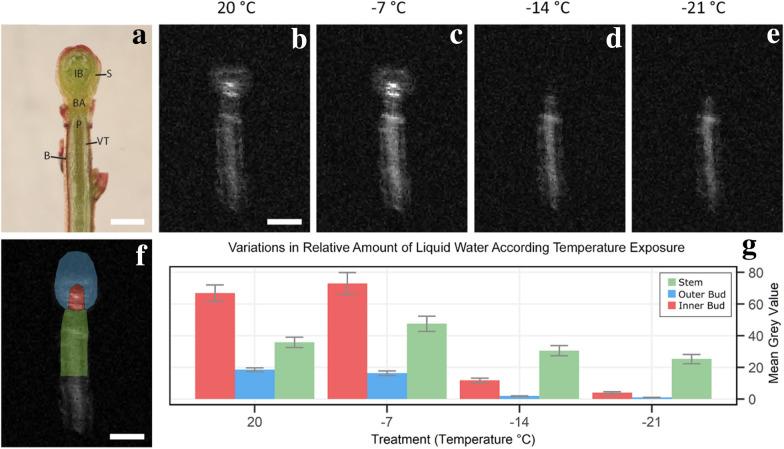
Example of a fresh V. macrocarpon bud in longitudinal section, obtained MRI images at evaluated temperatures, and plots of MGVs by defined ROIs. Fresh longitudinal section of V. macrocarpon bud indicating main anatomical structures (a) (B = bark; BA = bud axis; IB = inner bud (apical meristem and flower primordia); P = pith; S = bud scales; VT = vascular tissue). Longitudinal MR images obtained at 20, − 7, − 14, and − 21 °C (b–e, respectively) from specimens collected in November 2018 (n = 14). Images are close-ups of averages of 23 scans with a field of view of 30 × 30 mm with 512 × 512 pixels. Higher MGV (brighter) areas of images indicate unfrozen tissues. Evaluated ROIs of V. macrocarpon bud (f): blue = outer bud; red = inner bud; green = stem. Plot of changes in MGV for each ROI by temperature exposure (G), originally published in Villouta et al. [19]. Vertical error bars represent the standard error of the mean. Scale bar in A, B, and F equals 1 mm

