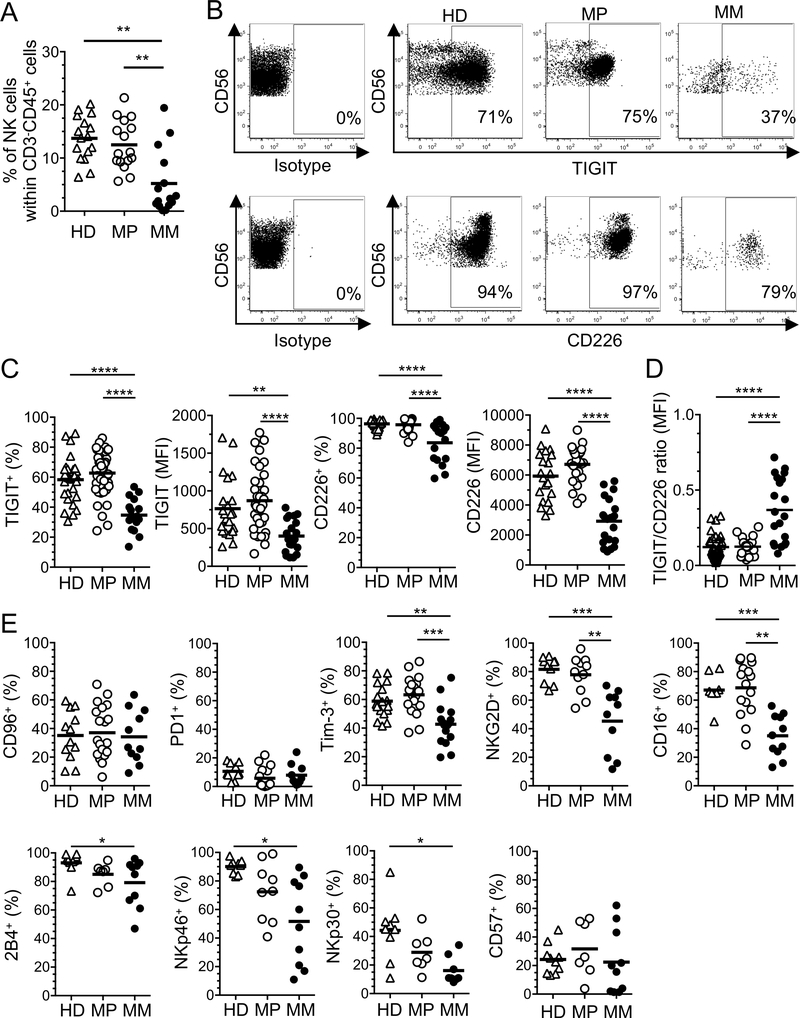
Figure 1. Tumor-infiltrating NK cells downregulate TIGIT and CD226.
CD3−CD45+CD56+ NK cells were evaluated side by side in PBMCs of healthy donors (HD) and melanoma patients (MP) and in metastatic melanoma (MM) using flow cytometry. (A) Pooled data showing the frequencies of NK cells within CD3−CD45+ cells (n=16 per group). (B) Representative dot plots showing the percentages of TIGIT and CD226 expression by NK cells. (C) Pooled data of TIGIT and CD226 expression (% and MFI) by NK cells in PBMCs (HD: n=30 and n=25, respectively; MP: n=39 and n=32, respectively) and MM (n=17 and n=14, respectively). (D) TIGIT/CD226 expression ratio (MFI) by NK cells (from panel C). (E) Percentages of CD96, PD-1, Tim-3, NKG2D, CD16, 2B4, NKp46, NK30 and CD57 expression by cNKs isolated from HDs (n=9–12) and MPs (n=7–20), and TiNKs (n=10–11). Horizontal bars depict means and P values were obtained by one-way ANOVA tests followed by Tukey’s multiple comparisons test with *, P<0.05; **, P<0.01; ***, P<0.001 and ****, P<0.0001. Data are representative of ten independent experiments.

