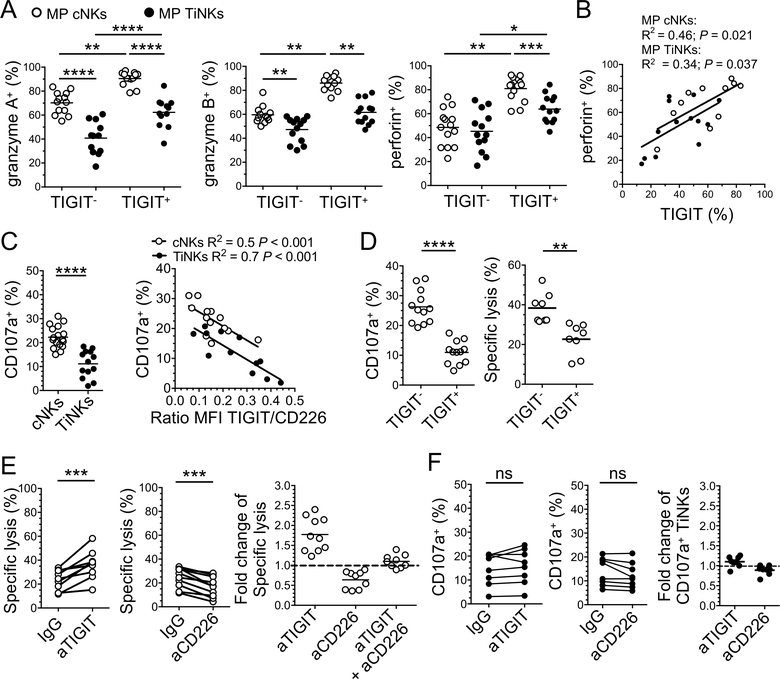
Figure 2. TIGIT blockade reinvigorates NK cell-mediated tumor reactivity in the periphery but not at tumor sites.
NK cells were isolated from PBMCs (cNKs) and tumors (TiNKs) of MPs. (A) Frequency of granzyme A-, granzyme B- and perforin-expressing NKs according to TIGIT expression (n=14). (B) Pearson correlation between the frequencies of perforin+ and TIGIT+ NKs. (C) NK degranulation capacity against FO-I (CD107a %) and Pearson correlation between degranulation capacity and TIGIT/CD226 ratio by NK (n=13). (D) Degranulation against FO-I (CD107a, n=12) and specific lysis of FO-I lysis (Chromium 51 release assay, n=8) by TIGIT+ and TIGIT− cNKs. (E) Specific lysis of FO-I by cNKs +/− aTIGIT, aCD226 blocking mAbs, or IgG control mAbs (frequency and fold change, n=10) (F). CD107a expression by TiNKs (n=8) in response to FO-I +/− aTIGIT +/− aCD226, or IgG control mAbs. Horizontal bars depict means and P values were obtained by unpaired t-tests (A and C) or paired t-tests (A, C-F), with ns (non-significant), P>0.05; *, P<0.05; **, P<0.01; ***, P<0.001 and ****, P<0.0001. Data are representative of at least three independent experiments.

