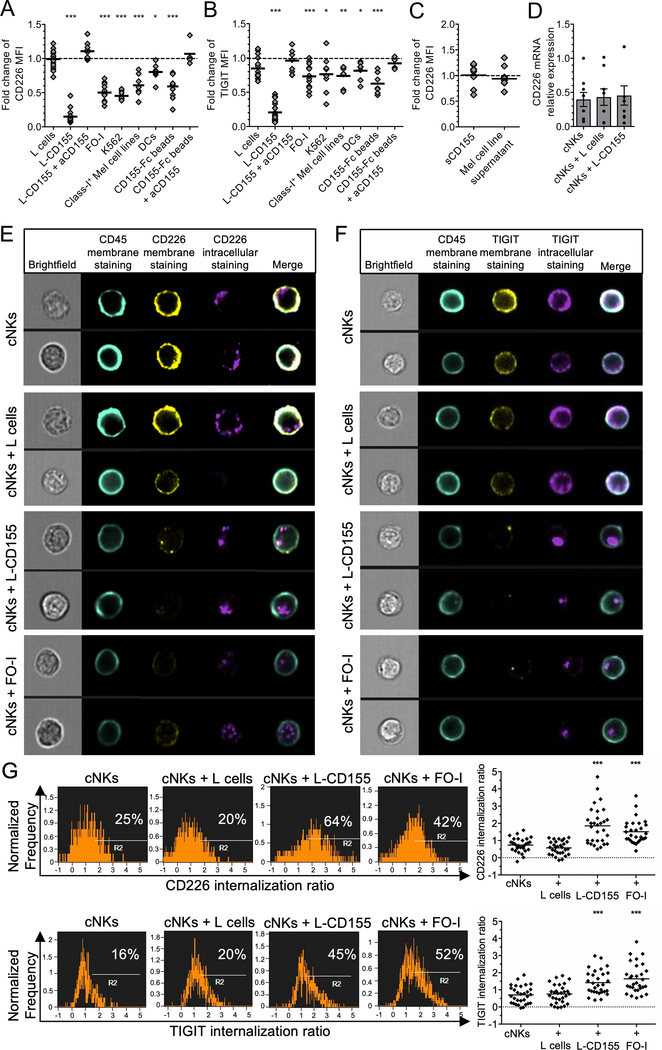
Figure 3. Membrane-bound CD155 induces TIGIT and CD226 internalization in NK cells.
(A and B) CD226 (A) and TIGIT (B) expression by cNKs (fold change of MFI) after 48 h incubation with indicated targets +/− aCD155 blocking mAb, as compared with control (no target, n=15, or IgG-coated beads, n=8). (C) Fold change of CD226 expression in MFI by cNKs incubated 48 h with sCD155 or the supernatants of melanoma cell lines (n=7). (D) CD226 mRNA relative expression by cNKs either alone, co-cultured for 48 h with L-cells, or with L-CD155 cells. Dots are means of triplicates (n=7). (E and F) Representative pictures from ImageStream analysis of cNKs alone or with indicated cell lines (1 h) depicting CD226 (E) and TIGIT (F) membrane (yellow) and intracellular (violet) expression, as well as surface CD45 expression (turquoise). (G) Representative histograms gated on total live cNKs (left panels) and statistical analysis from a pool of 30 randomly selected cNKs (right panels) showing the ratio of CD226 and TIGIT internalization by cNKs in the presence of L-CD155 and FO-I as compared with L cells or cNKs alone. Cell surface CD45 expression was used to calculate the internalization ratio of CD226 and TIGIT intracellular staining using IDEAS software. P values were obtained from one-way ANOVA tests (A and B) or repeated-measure ANOVA tests (D and G) followed by Dunnett’s multiple comparisons test with *, P<0.05; **, P<0.01 and ***, P<0.001. Horizontal bars depict means (A-C and G) or means ± SEM (D). Data are representative of at least three independent experiments.

