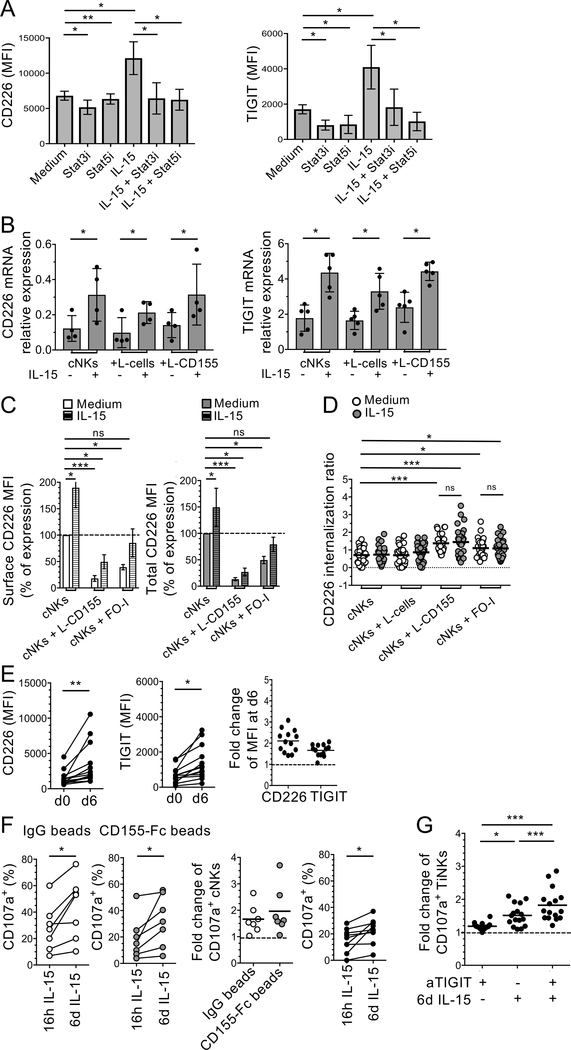
Figure 5. IL-15 together with TIGIT blockade reverses CD155-induced NK cell dysfunction.
(A) Pooled data showing the effect of STAT3 and STAT5 inhibitors (Stat3i and Stat5i, respectively) on CD226 and TIGIT expression (MFI) by cNKs after 6 d incubation +/− IL-15 (n=6). (B) Pooled data of from three independent experiments showing CD226 and TIGIT mRNA relative expression by cNKs from MPs after 48 h incubation with indicated cell lines +/− IL-15 (n=4 and n=5, respectively). (C) Surface and total CD226 expression by cNKs after 48 h incubation with L-CD155 or FO-I +/− IL-15 (normalized MFI ratio as compared with cNKs in medium alone). (D) Pool of 30 randomly selected cNKs from one representative ImageStream analysis (n=3), showing CD226 internalization ratio after 1 h incubation with indicated cell lines. (E) CD226 and TIGIT expression (MFI and fold change) by TiNKs, ex-vivo and after 6 d incubation with IL-15 (n=13). (F) Pooled data comparing CD107a expression by cNKs treated 48 h with indicated beads (frequency and fold change), and by TiNKs (frequency) after 16 h or 6 d IL-15 stimulation (n=7 and n=10, respectively), in response to FO-I. (G) Fold change of CD107a+ TiNKs after 16 h or 6 d IL-15 stimulation prior to incubation with FO-I +/− aTIGIT mAbs (n=16) as compared with 16 h IL-15 + IgG control mAb (dotted line). Horizontal bars depict means ± SD (A and B) or ± SEM (C). P values were obtained by paired t-tests (E and F), ordinary (D) or repeated-measures one-way ANOVA tests followed by Tukey’s (B, and G) or Dunnett’s (C) multiple comparisons test, with *, P<0.05; ***, P<0.01 and ***, P<0.001. Data are representative of at least three independent experiments.

