Figure 5.

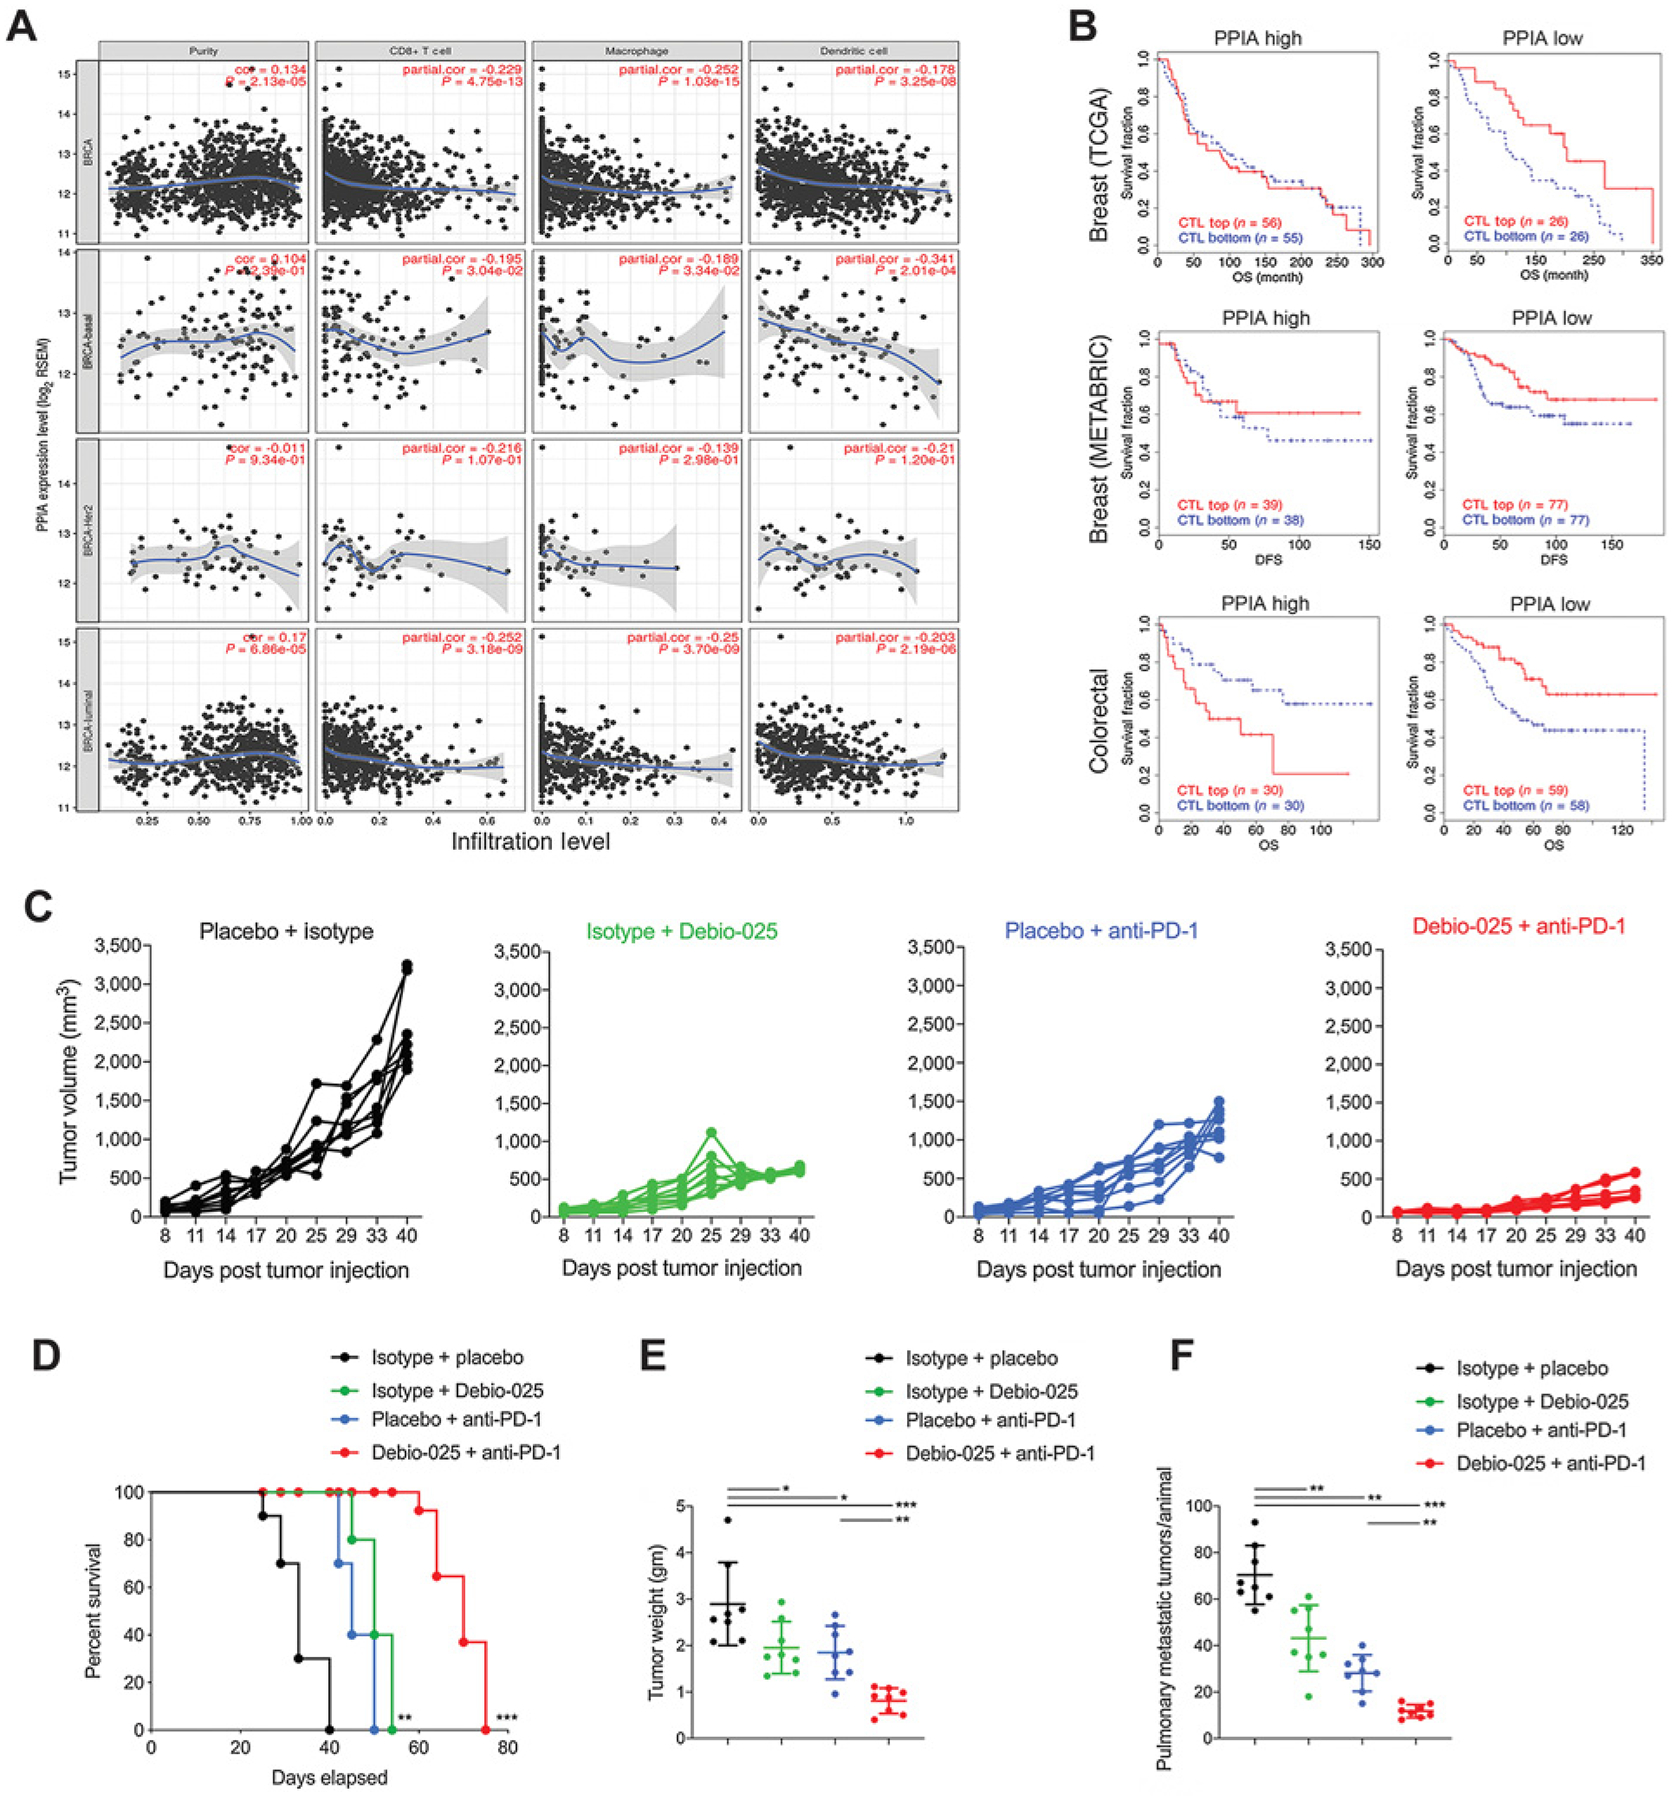
CypA expression negatively correlates with cytotoxic immune cell populations and clinical response to checkpoint blockade and targeting CypA provides enhanced therapeutic response with immunotherapy. A, TIMER analysis plots for breast cancer–sequencing data from TCGA plotted and classified for overall breast cancer specimens (BRCA), basal subtype (BRCA-basal), Her2-negative subtype (BRCA-Her2), and luminal subtype (BRCA-luminal). Adjusted for purity of tumor samples sequencing data, correlation plots show CypA expression and extent of infiltration levels of CD8+ T cells, macrophage, and dendritic cells inferred from sequencing data. B, TIDE analysis plots for estimation of CypA as a gene expression biomarker to predict the clinical response to immune checkpoint blockade in CypA-high and -low expressing breast tumors (top, TCGA cohort), (middle, METABRIC cohort), and colorectal tumors (bottom, TCGA cohort). Estimation of efficacy of Debio-025 anti-PD-1 combination therapy in suppressing primary and metastatic 4T1 tumors: Debio-025 and anti-PD-1 or isotypes and vehicle control on 4T1 tumor growth were administered (see Materials and Methods for details) to estimate changes in primary tumor growth (C), survival (D), tumor weight (E), and pulmonary metastasis (F; n = 6–8/group). Error bars, SD; all P values are based on one-sided Student t tests or two-way repeated measure ANOVA. *, P < 0.05; **, P < 0.001; ***, P < 0.001; DFS, disease-free survival; OS, overall survival.
