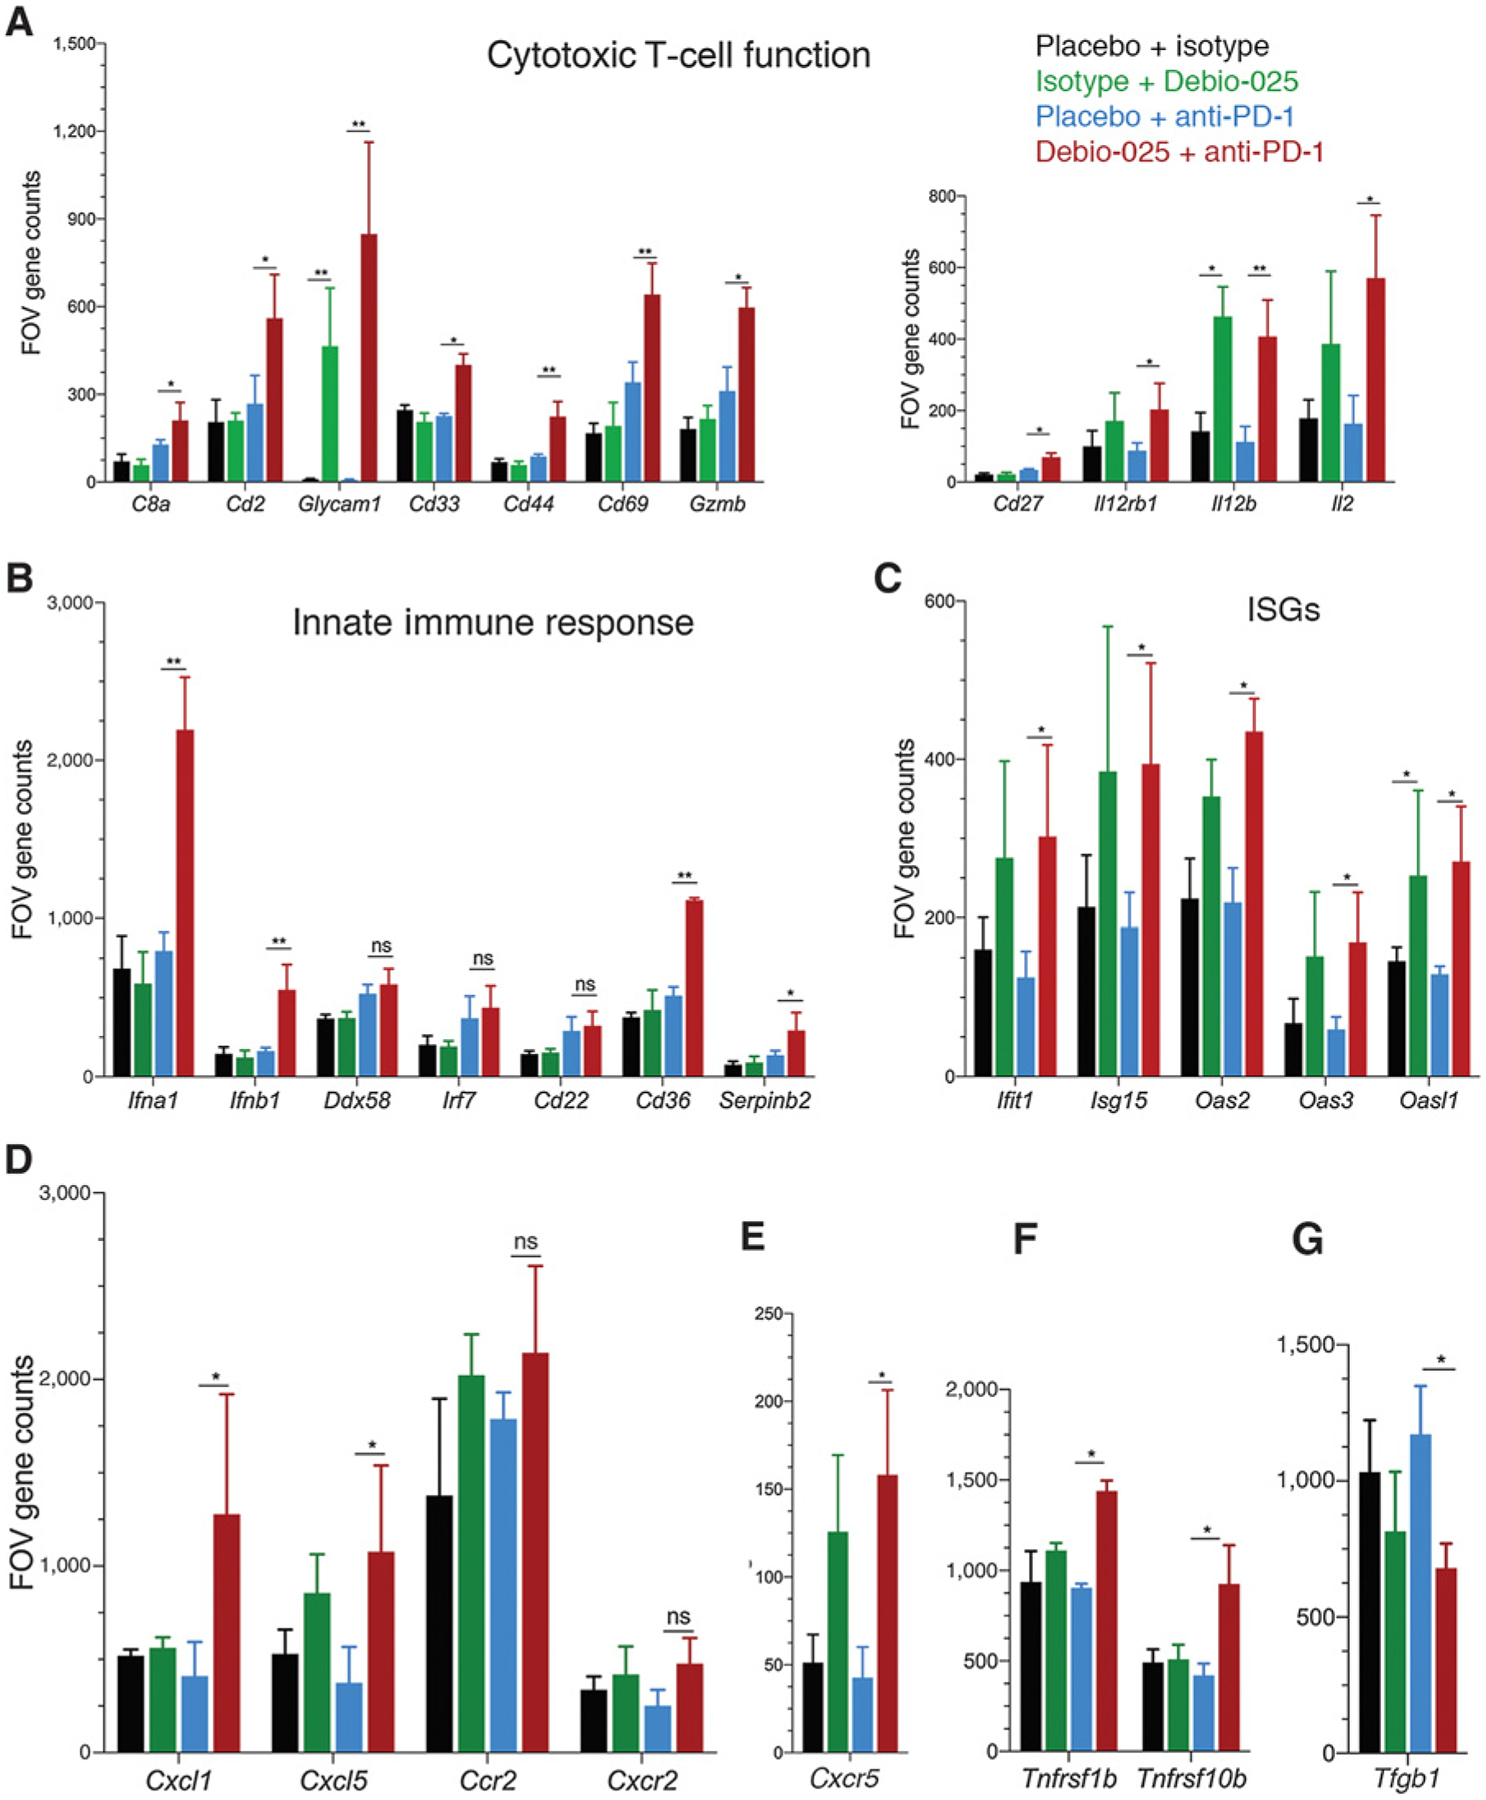
Figure 6.

Effect of Debio-025 and anti-PD-1 combinatorial therapy on enrichment of antitumoral immune cell response. Gene expression of immune-related genes using NanoString pan-cancer immune profiling panel was performed from tumors harvested at the end of the study from placebo + isotype, placebo + anti-PD-1, isotype + Debio-025, and Debio-025 + anti-PD-1 treatment groups and subjected to NanoString analysis. FOV counts per gene from each sample were calculated from normalized expression presented using nSolver software. A, FOV counts for T-cell markers and cytokines related to T-cell function are shown (CD8a, Cd2, Glycam1, Cd33, Cd44, Cd69, Gzmb, Cd27, Il12rb1, Il12b, and Il2). B, FOV counts from RNA-based NanoString analysis for innate immune response markers are shown for each treatment group (Cd22, Cd36, Ddx58, Ifna1, Ifna4, Ifnb1, and Irf7). C, IFN-stimulated gene (ISG) expressions between different groups are shown (Ift1, Isg15, Oas2, Oas3, and Oasl1). Immuno-attractant chemokines (Cxcl1 and Cxcl5; D) and receptors (Ccr2 and Cxcr2) and Cxcr5 (E), antitumor chemokine receptors (Tnfrsf10b and Tnfrsf1b; F), and TGFβ (G) gene expressions between each group are shown. RNA expression values are presented in FOV counts and graphically represented by GraphPad Prism. Error bars indicate SD. Statistically significant differences are indicated in each case. *, P < 0.05; **, P < 0.01; versus vehicle group (n = 3 per group; Student two-tailed t test; ns, nonsignificant).
