
Figure 5.
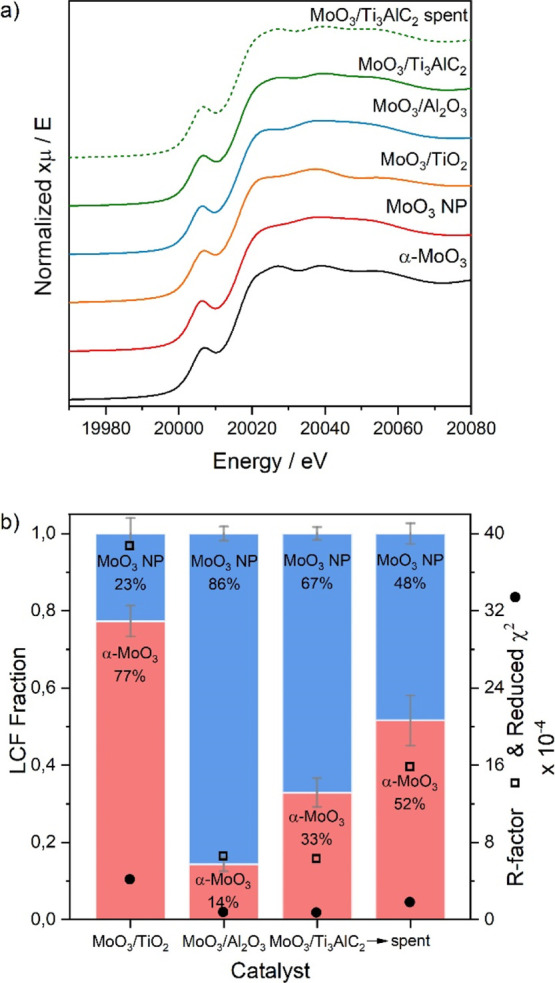
(a) Mo K-edge XANES spectra of the supported catalysts and reference structures. (b) Summary of the LCF analysis of the supported catalysts using reference spectra. The quality of the fit is indicated by the R-factor and reduced χ2 value.
Official websites use .gov
A
.gov website belongs to an official
government organization in the United States.
Secure .gov websites use HTTPS
A lock (
) or https:// means you've safely
connected to the .gov website. Share sensitive
information only on official, secure websites.
(a) Mo K-edge XANES spectra of the supported catalysts and reference structures. (b) Summary of the LCF analysis of the supported catalysts using reference spectra. The quality of the fit is indicated by the R-factor and reduced χ2 value.