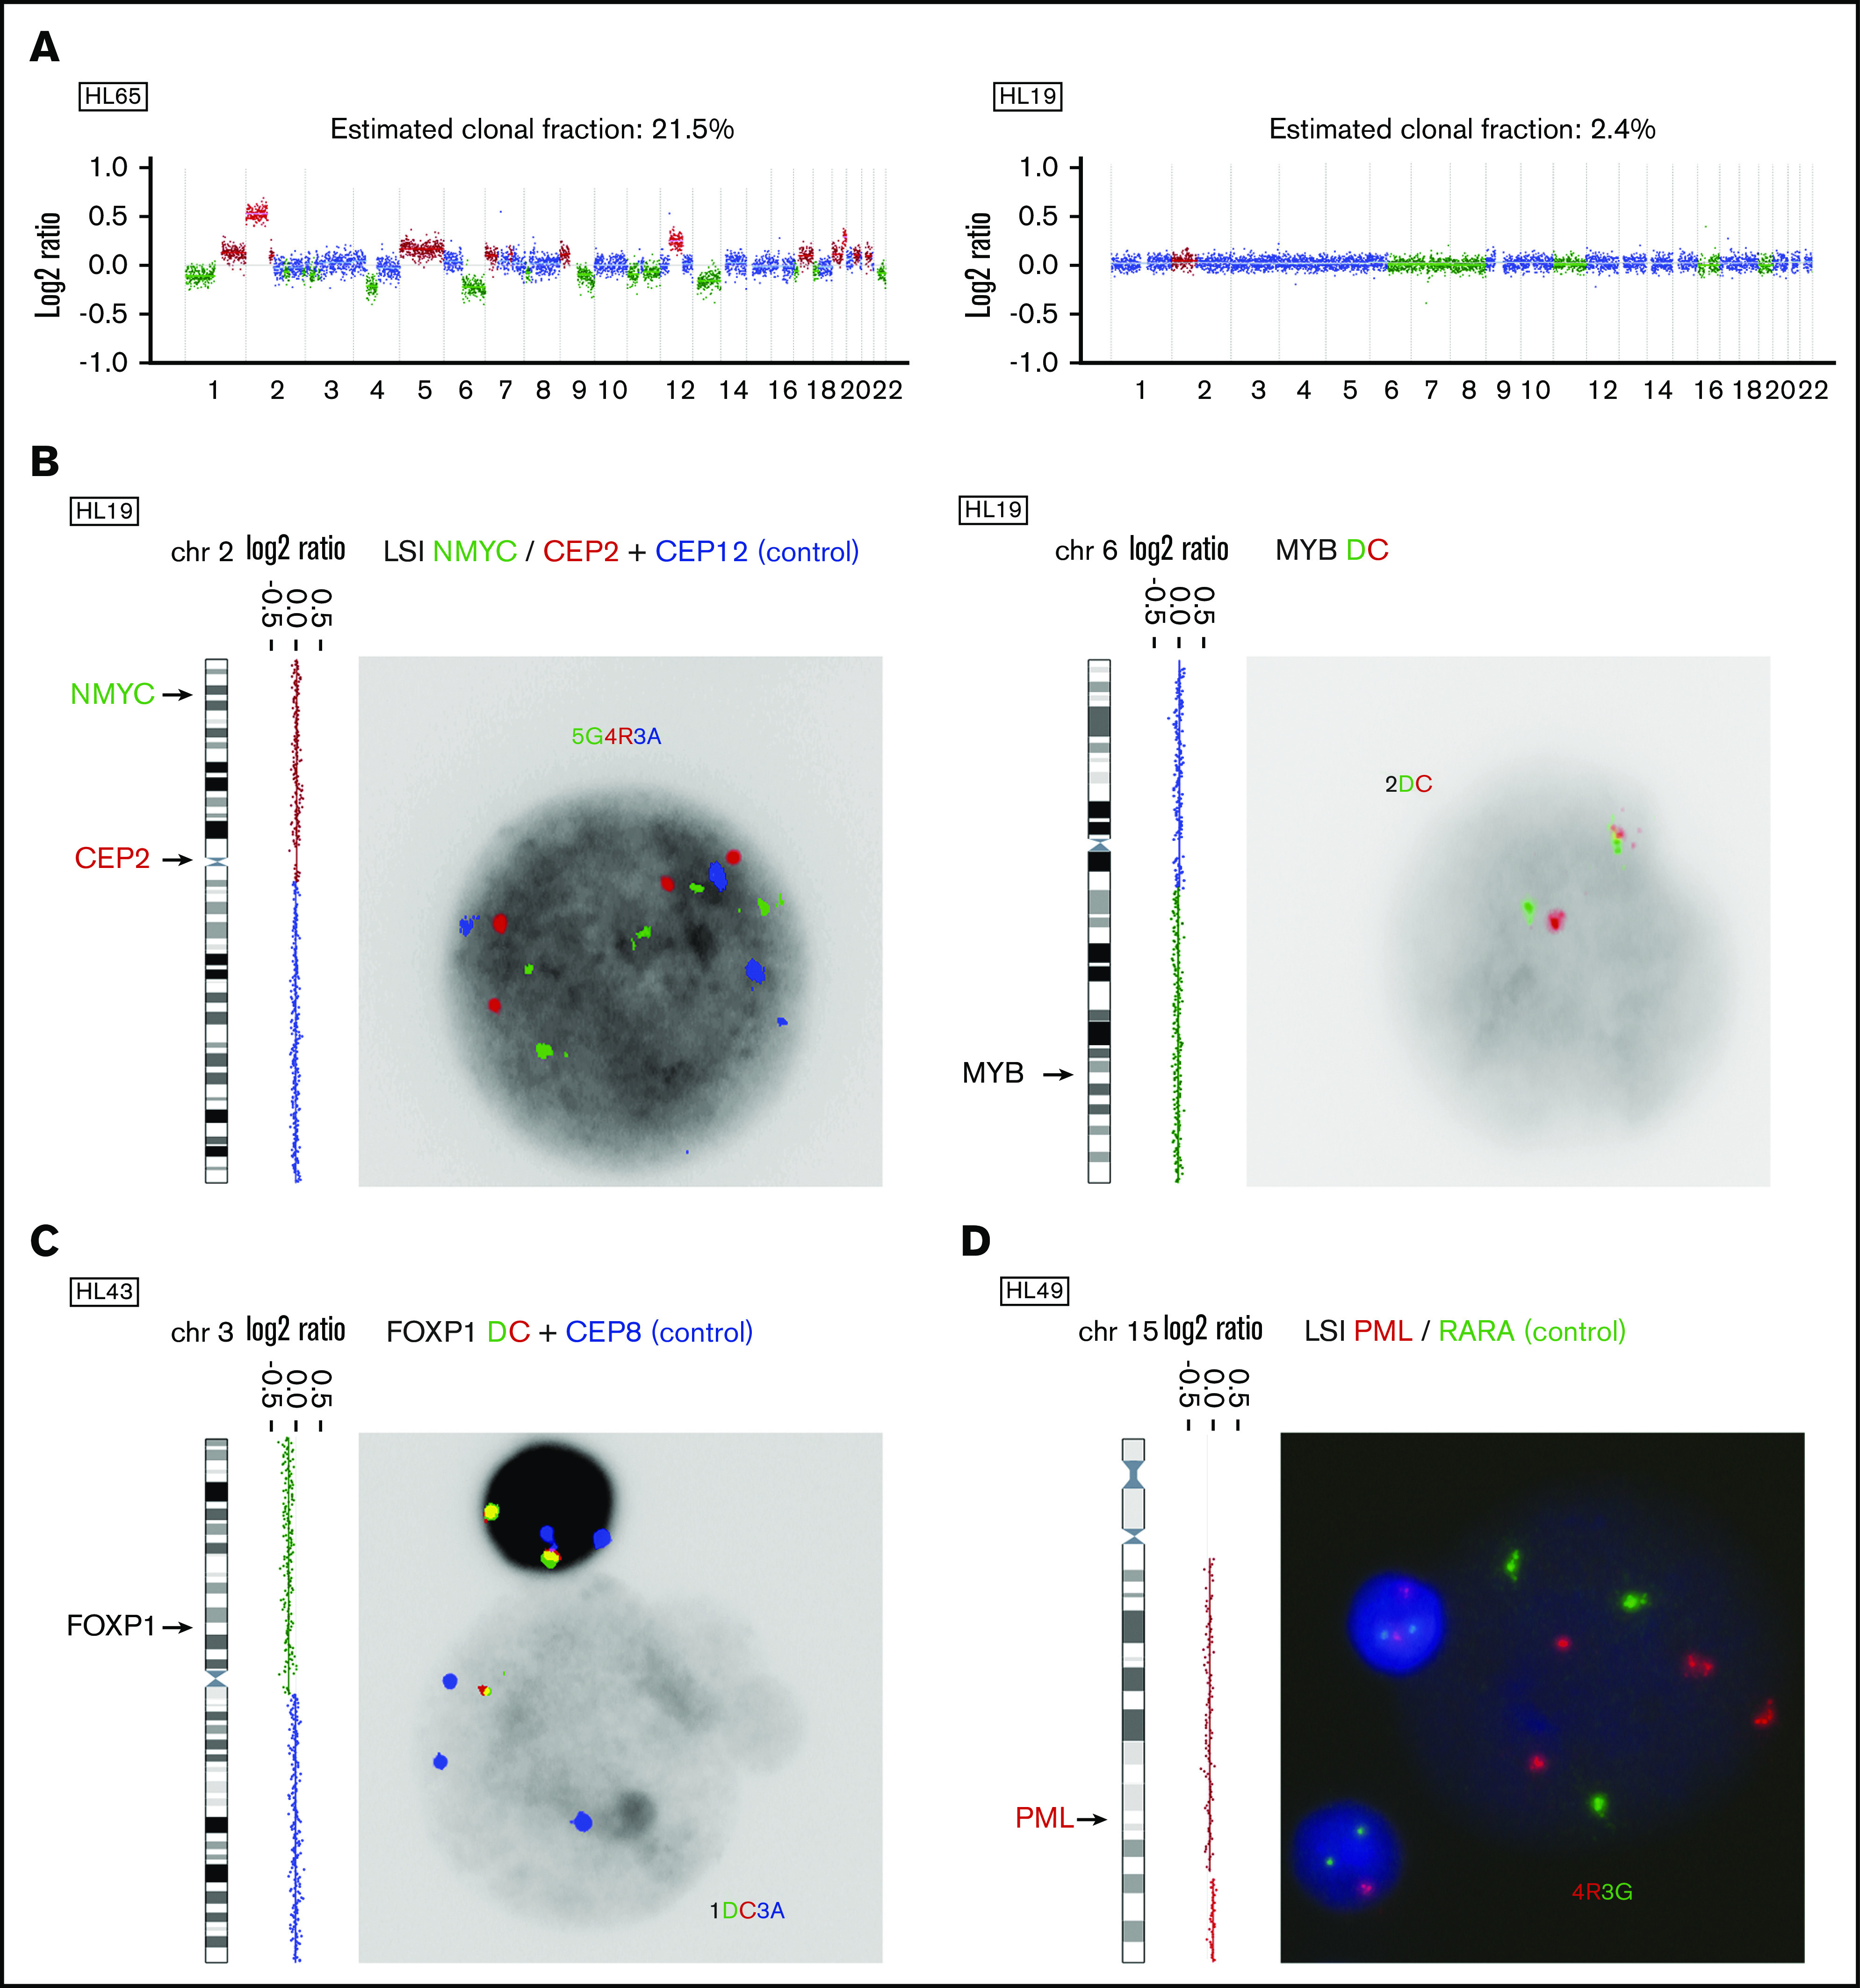
Figure 1.

Detection and FISH validation of CNAs in cfDNA. (A) Illustrative ichorCNA output for 2 cases with a high (left) vs low (right) estimated clonal fraction. Genome-wide log2 ratios are plotted and colored according to CN status (green = loss; blue = copy neutral; brown = gain; red = amplification). (B) Validation of CNAs in the case of HL19 by interphase FISH on fixed cytogenetic specimens. At the left, the log2 plot for the chromosome of interest is shown, with an arrow indicating the genomic location of the FISH probe used. Probes are shown with their respective colors (green [G]: spectrum green; red [R]: spectrum orange; blue [A]: spectrum aqua; red/green [DC]: dual color break apart probe) and the FISH patterns of the large HRS cells are indicated. (C-D) Validation of novel recurrent CNAs in cfDNA by interphase FISH: loss of 3p13-p26 (C) and gain of 15q21-q26 (D). CEP, centromeric probe; LSI, locus specific identifier.
