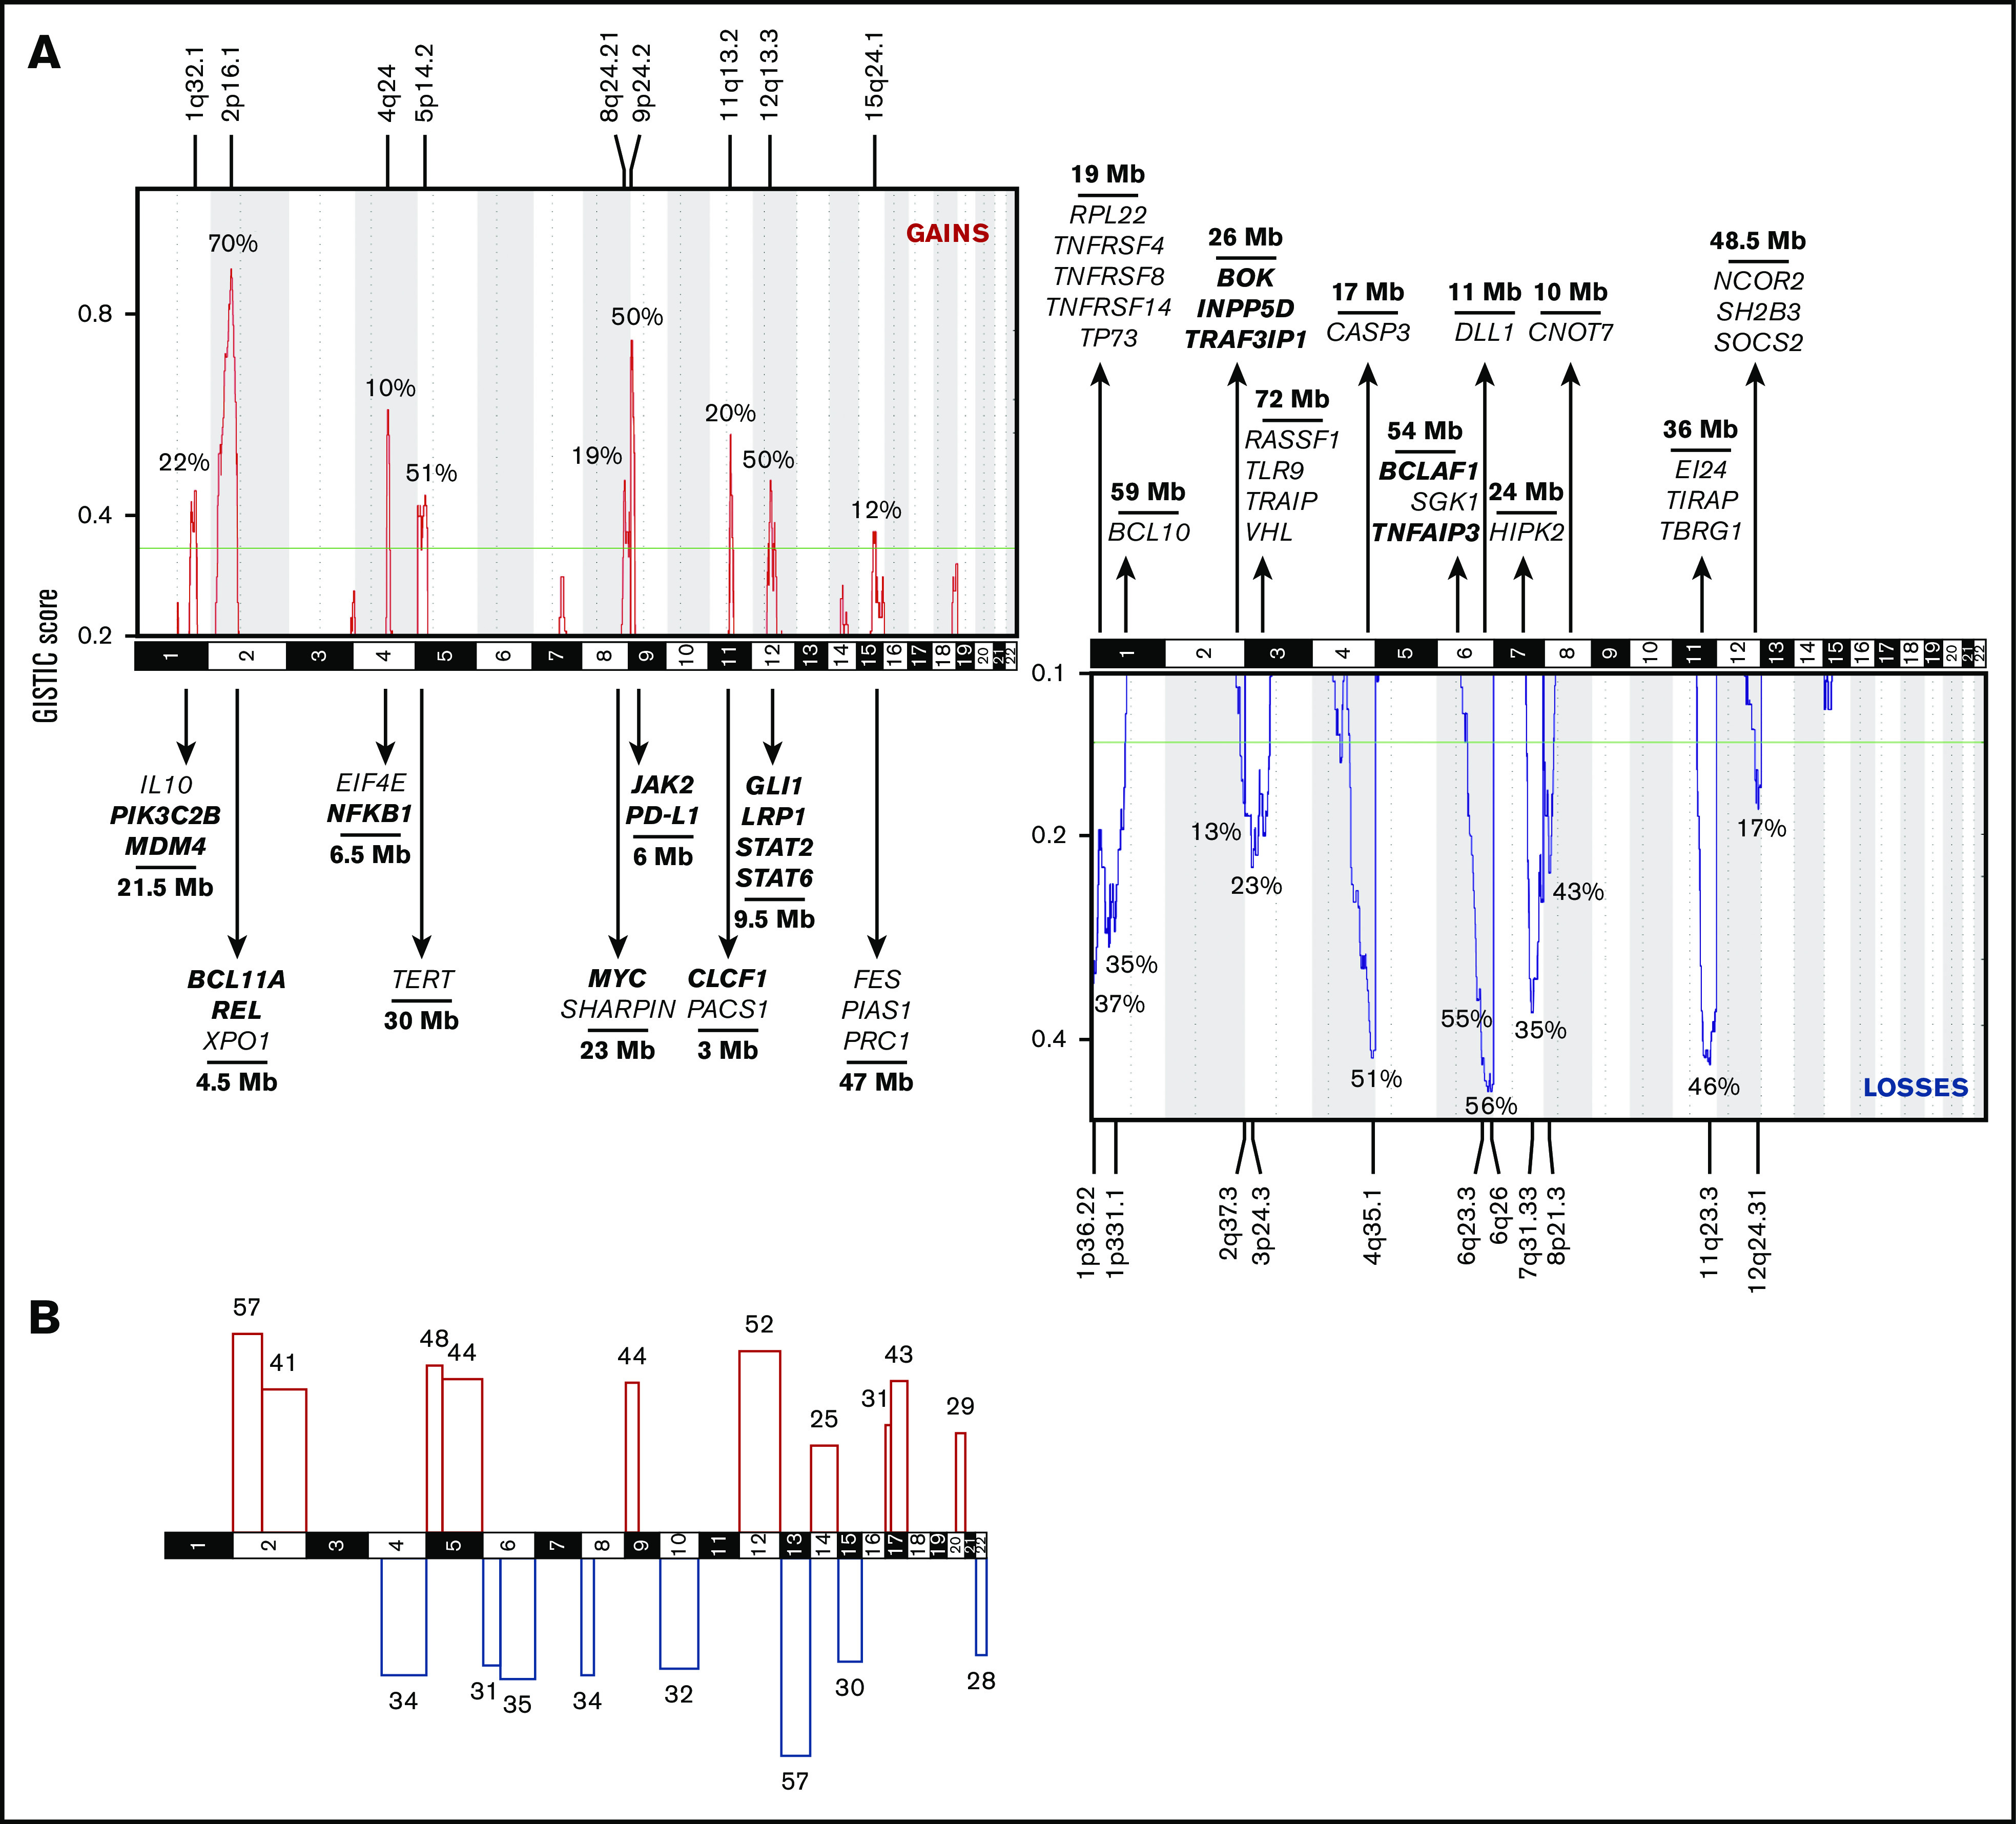
Figure 2.

Recurrent CNAs in cHL. (A) Recurrent CNAs in abnormal cases (n = 164) were evaluated using GISTIC. The y-axis shows the G score as a function of chromosomal location (x-axis) for gains (red) and losses (blue). G scores exceeding the green line represent significantly recurrent aberrations. The latter are shown with their frequency within this cohort, their genomic location, and their size. CancerMine was browsed for tumor suppressor and oncogenes involved in “hematologic cancers,” “lymphoma,” “B-cell lymphoma,” “Hodgkin lymphoma,” “non-Hodgkin lymphoma,” and “diffuse large B-cell lymphoma.” GO gene lists were extracted for the JAK-STAT pathway (GO:0007259), NF-kB pathway (GO:0038061 and GO:0007249), Notch signaling (GO:0007219), TNFR signaling (GO:0033209), cytokine-mediated pathway (GO:0019221), negative and positive regulation of apoptotic signaling pathway (GO:2001234 and GO:2001235), and B-cell receptor signaling (GO:0050853). A selection of genes that are located within the wider boundaries as determined by GISTIC is shown. Genes within the minimally common region (see “Materials and methods”) are printed bold. (B) Broad CNAs are defined as comprising at least 90% of a chromosome arm. Frequencies (%) are plotted for significantly gained (red) or lost (blue) p or q arms.
