
Figure 10.
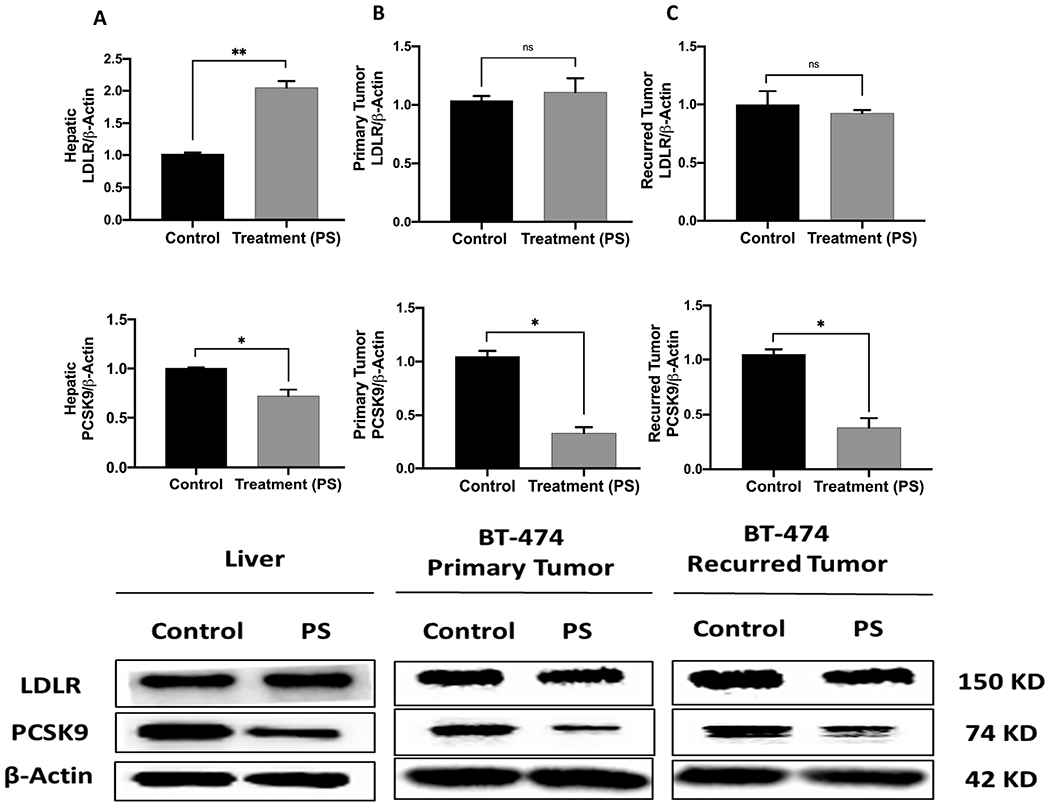
The in vivo effects of PS treatments on the PCSK9 and LDLR expression levels in orthotopically xenografted BT-474 BC cells in athymic nude mice and in collected animal livers. Top panels represent the densitometric analysis of all blots and bottom panels are representative Western blots for LDLR and PCSK9. (A) The expression of levels of LDLR and PCSK9 in nude mice liver samples collected after the experiment end. (B) The expression levels of LDLR and PCSK9 in breast primary tumors surgically resected from BT-474 cells growth model animals. (C) The expression levels of LDLR and PCSK9 in BT-474 cells recurrence tumors collected after the experiment end. Scanning densitometry was obtained for all blots, carried out in triplicate, and the integrated optical density of each band was normalized with the corresponding density found for β-actin in the same blot, results shown in the bar graphs under their respective western blot images. Vertical bars in the graph indicate the normalized integrated optical density of bands visualized in each lane. *p < 0.05 and **p < 0.01 for statistical significance compared to respective vehicle-treated control group.