
Figure 7.
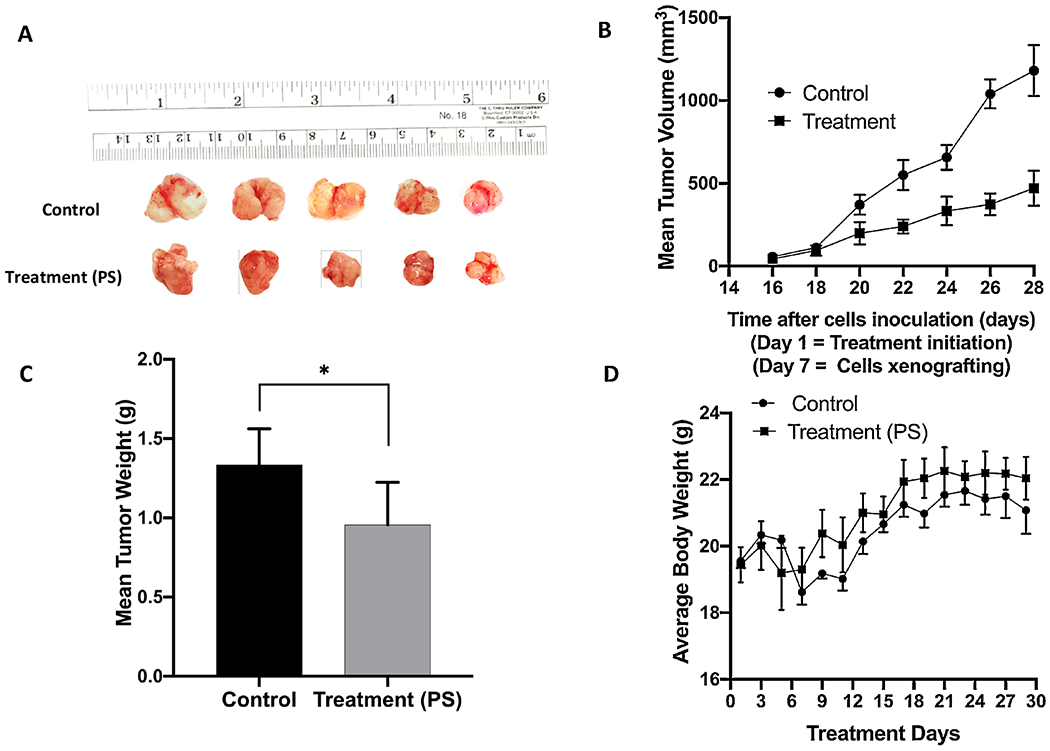
Effects of oral PS treatment on the progression of the orthotopically xenografted BC cells BT-474 in HFD-fed athymic nude mice. (A) Representative primary tumors of each experimental group collected after surgical excision surgeries. Top row is the vehicle-treated control group, and the bottom row is the PS-treated group, 10 mg/kg, oral, 7X/week. (B) Comparative monitoring of the mean BT-474 cells tumor volume for the PS-treated daily oral 10 mg/kg mice versus the vehicle-treated control group over the experiment duration. Points represent the mean tumor volumes, and error bars represent the SEM for each experimental group. (C) The mean tumor weights in PS-treated versus vehicle control-treated at the experiment end. Error bars indicate SEM. * p<0.05 for statistical significance compared to vehicle-treated control group. (D) Mice body weight-monitoring over the experiment course. Points represent the mean body weight for animals in each group. Error bars indicate SEM.