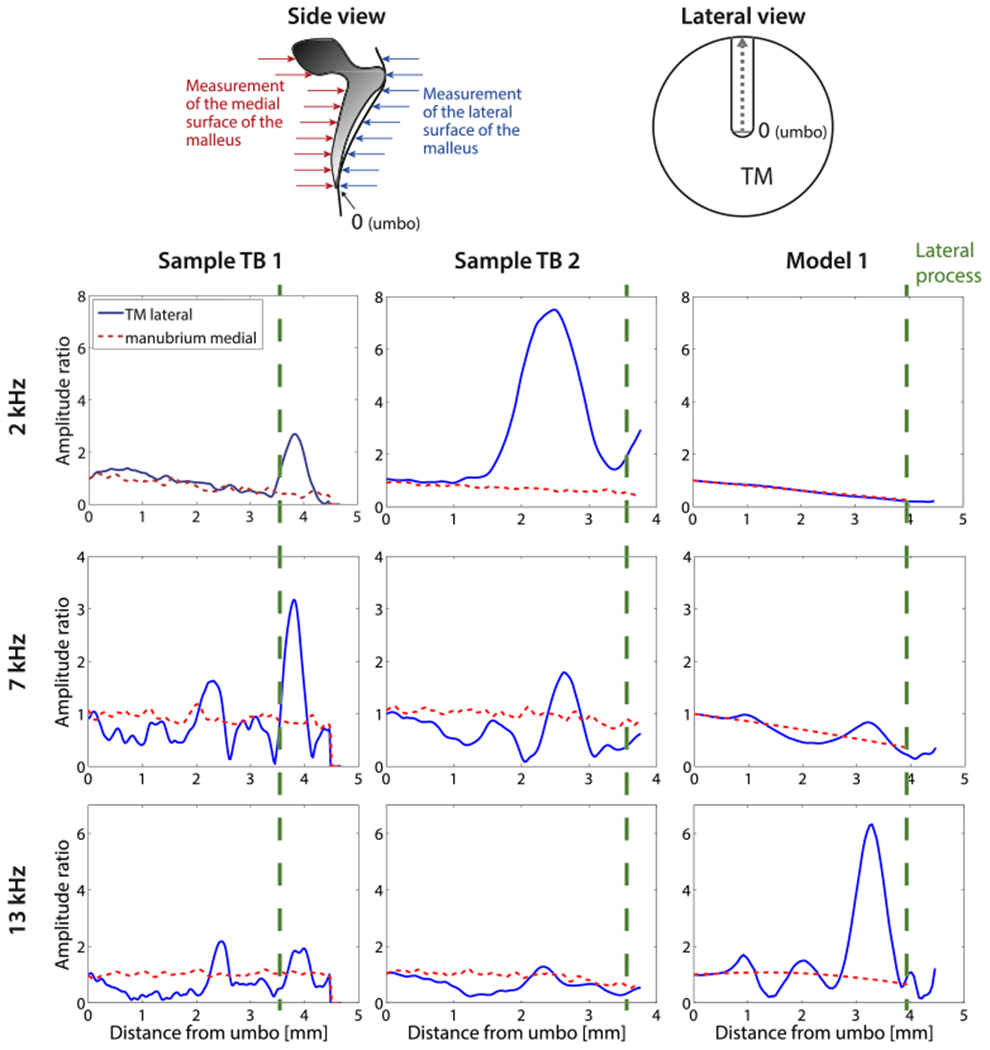
Fig. 10.

Comparison of lateral displacements of the TM along the length of its attachment to the manubrium and medial displacements of the manubrium and malleus neck and head, for frequencies of 2, 7 and 13 kHz. The schematic on the upper right represents the view of the lateral surface of the manubrium from the ear canal. The schematic on the upper left illustrates the motion components that were measured by the holography system when it viewed either the lateral or medial surface of the TM. The data are normalized to the umbo. Left and middle column: Holographically measured displacements from sample TB1 and TB2. Right column: model prediction of the motion of the lateral surface of the TM opposite to the manubrium and the medial surface of the manubrium. The vertical dashed lines on the plots indicate the location of the lateral process. Locations on the lateral surface of the ear canal superior to the lateral process represent measurements on the surface of the pars flaccida of the TM. (For interpretation of the references to colour in this figure legend, the reader is referred to the web version of this article.)
