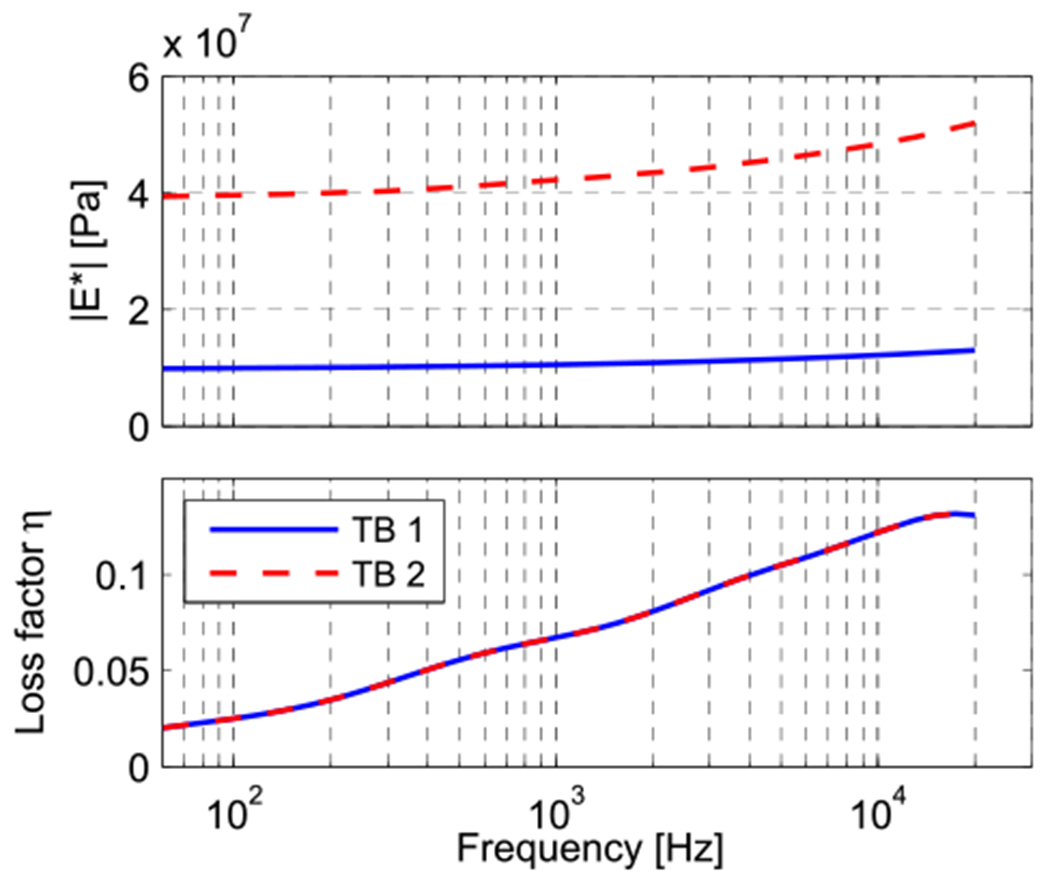
Fig. 11.

Complex modulus magnitude and phase values of the TM used for the two model data sets. Both magnitude curves differ merely by a multiplication factor, while the phase data is equal for both models and represents model 1 defined in Section 2.2.3 and depicted in Fig. 6.
