Figure 7.
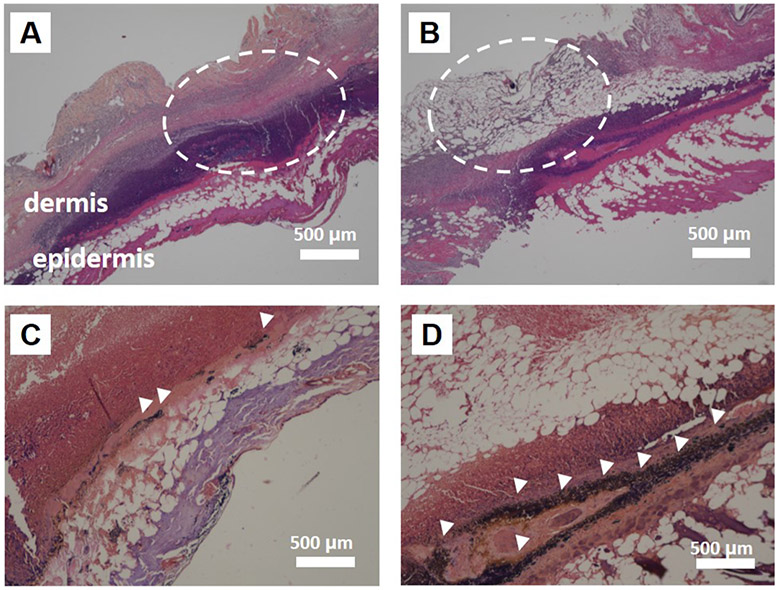
Histopathology. (A, B) Histology of the infected skin tissue of mice by H&E staining. Dermis and epidermis structure of treated group (Au/Ag (Etch)) were maintained (white dashed circle) in A. In contrast, serious damage was seen for the untreated control (white dashed circle) in B. Images were obtained 1 week after the treatment. Scale bar is 500 μm. (C, D) Gram-positive staining for MRSA. The purple-stained MRSA species on the infected tissue are indicated by white arrowheads in the images. There are dramatically fewer MRSA detected for the treated group (Au/Ag (Etch)) in C compared to the untreated control in D. Scale bar is 500 μm.

