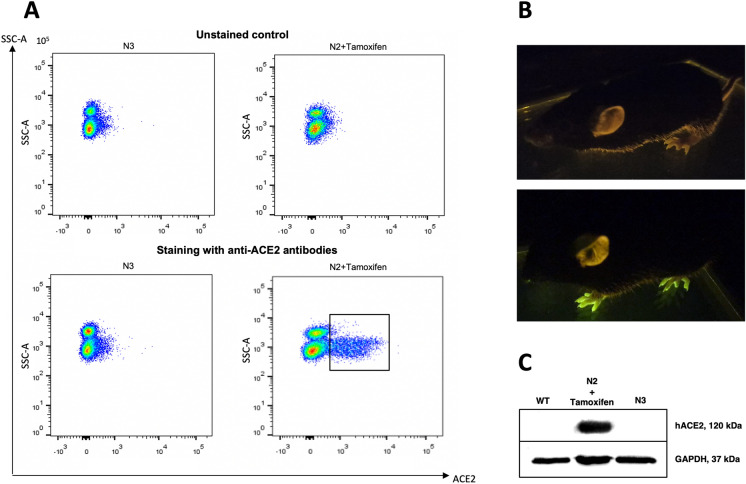
Fig. 5.
Detection of hACE2 and GFP. a hACE2 presence on the surface of PBMCs. a Activated transgenic mouse N2 hACE2(LoxP-Cre) (right lower panel) compared to the nonactivated transgenic mouse N3 hACE2(LoxP-Stop) (left lower panel). Unstained controls are represented in the upper panel. b The N2 mouse skin in the UV chamber before (upper) and after (lower) tamoxifen induction. c Western blot analysis of hACE2 expression in PBMCs. Glycosylated 120 kDa hACE2 in the upper panel and 37 kDa GAPDH in the lower panel. A WT mouse is shown on the left, an activated transgenic mouse is shown in the middle, a nonactivated transgenic mouse is shown on the right

