
Figure 5.
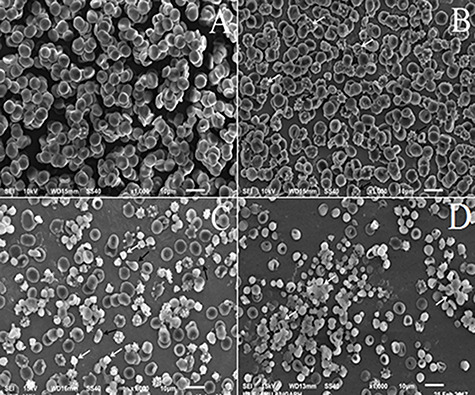
SEM images of control and HOCl treated RBC. (A) untreated RBC (control); RBC treated with (B) 0.25 mM (C) 1.0 mM and (D) 2.5 mM HOCl. Magnification is ×1000.
Official websites use .gov
A
.gov website belongs to an official
government organization in the United States.
Secure .gov websites use HTTPS
A lock (
) or https:// means you've safely
connected to the .gov website. Share sensitive
information only on official, secure websites.
SEM images of control and HOCl treated RBC. (A) untreated RBC (control); RBC treated with (B) 0.25 mM (C) 1.0 mM and (D) 2.5 mM HOCl. Magnification is ×1000.