
Figure 1 .
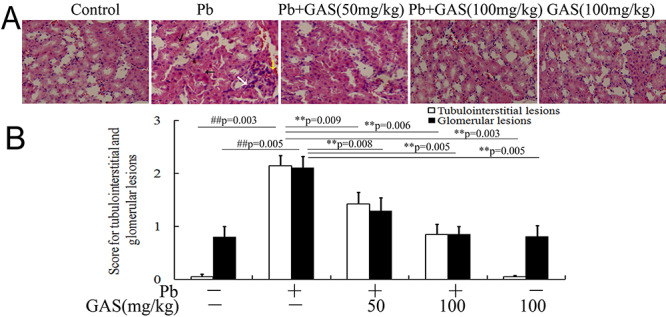
GAS improved histological alterations in the kidneys of the Pb group. (A) Representative histological images of hematoxylin and eosin (H&E) in kidney sections (×200). (B) The score for tubulointerstitial and glomerular lesions. The white arrow indicates infiltrating leukocytes. The black arrow indicates renal tubular epithelial cell denaturation, cell swelling, vacuolar degeneration, and necrosis. The yellow arrow indicates Bowman capsule distortions. All values are expressed as mean ± S.E.M. (n = 3). ##P < 0.05, compared with the control group; **P < 0.05, vs. Pb-treated group.