
Figure 2 .
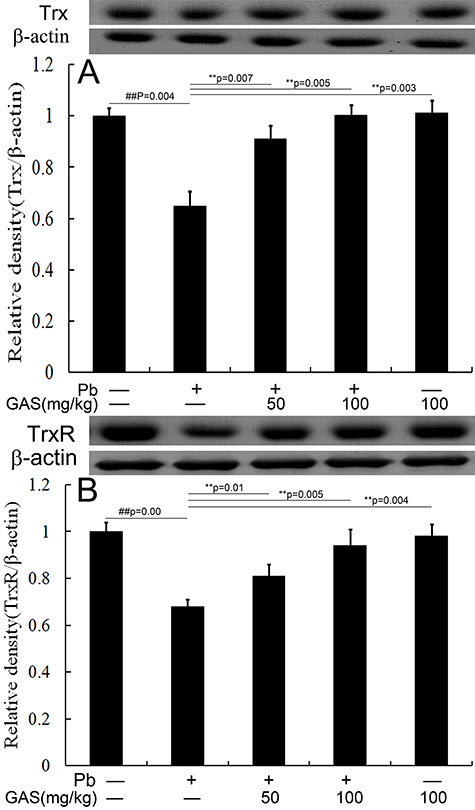
GAS activated the Trx pathway in the kidneys of mice. (A) Relative density analysis of the Trx protein bands. (B) Relative density analysis of the TrxR protein bands. β-actin was probed as an internal control in relative density analysis. The vehicle control is set as 1.0. Data are expressed as mean ± S.E.M. and representative of at least three independent experiments (individual animals). All values are expressed as mean ± S.E.M. ##P < 0.05, compared with the control group; **P < 0.05, vs. Pb-treated group.