
Figure 5 .
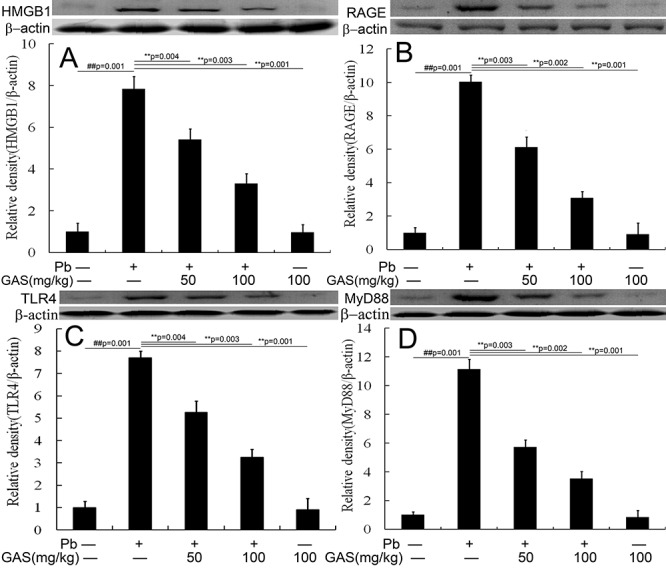
GAS inhibited the HMGB1 pathway in the kidneys of mice. (A) Relative density analysis of the HMGB1 protein bands. (B) Relative density analysis of the RAGE protein bands. (C) Relative density analysis of the TLR4 protein bands. (D) Relative density analysis of the MyD88 protein bands. β-actin was probed as an internal control in relative density analysis. The vehicle control is set as 1.0. Data are expressed as mean ± S.E.M. and representative of at least three independent experiments (individual animals). All values are expressed as mean ± S.E.M. ##P < 0.05, compared with the control group; **P < 0.05, vs. Pb-treated group.