
Figure 6 .
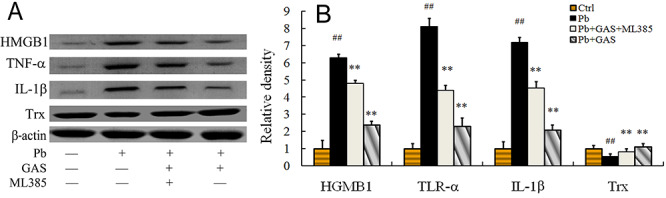
The expression levels of the TNF-α, IL-1β, Trx and HGMB1 in kidney mesangial cells. (A) Western blot analysis of the TNF-α, IL-1β, Trx, and HGMB1 proteins. (B) Relative density analysis of the TNF-α, IL-1β, Trx, and HGMB1 protein bands. β-actin was probed as an internal control in relative density analysis. The vehicle control is set as 1.0. Data are expressed as mean ± S.E.M. and representative of at least three independent experiments. All values are expressed as mean ± S.E.M. ##P < 0.05, compared with the control group; **P < 0.05, vs. Pb-treated group. GAS: Gastrodin; Pb: lead; ML385: The Nrf2 inhibitor ML385.