
Figure 3.
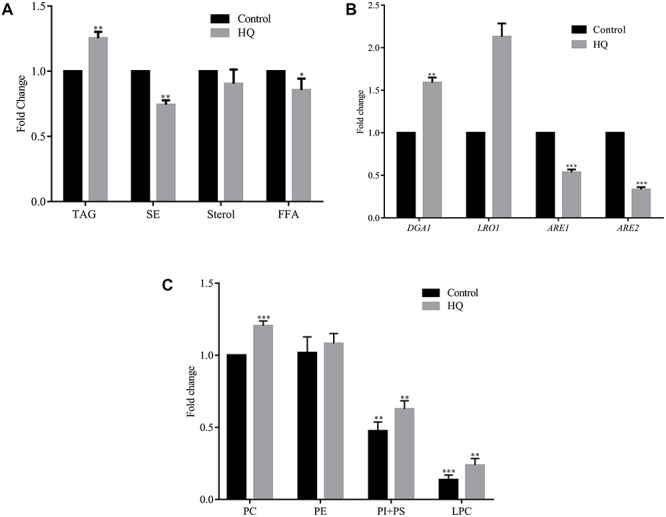
Effect of hydroquinone on lipid composition. Wild-type cells were grown in the presence or absence of HQ for 12 h, and the lipids were extracted and resolved on TLC. (a) The graphical representation of neutral lipids profile. (b) Neutral lipid synthesizing genes expression (DGA1, LRO1, ARE1 and ARE2) using qRT-PCR. (c) The figure shows the graphical representation of the phospholipid profile of wild-type cells.