
Figure 5.
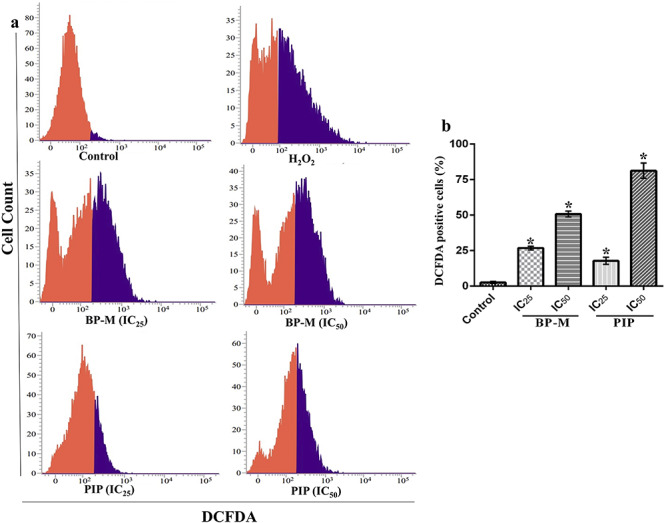
treatment of black pepper methanol extract and piperine (IC25 and IC50, 48 h) induces the generation of ROS in K-562 cells. (a) Representative FACS analysis of cells using DCFDA staining. Red and purple zone represents unstained and stained cells, respectively. (b) Bar graph indicating the percentage of DCFDA stained K-562 cell count determined by FACS analysis as treated in (a). Results are the representation of three independent experiments with mean ± SEM. * indicates P < 0.05 as compared with control group. BP-M, black pepper methanol extract; PIP, piperine; IC25 and IC50, IC25 and IC50 equivalent concentrations, respectively.