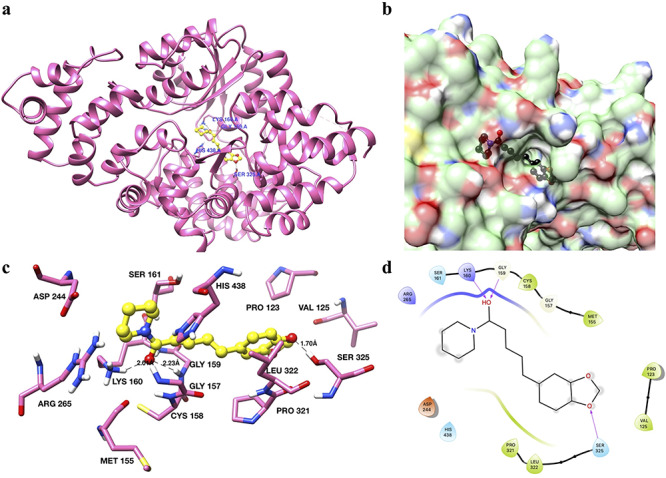
Figure 9.

binding analysis of piperine with Apaf-1. (a) The overall structure of Apaf-1 (ribbon diagram) with piperine docked in the active site shown in yellow color and ball and stick representation. Interacting residues are shown in sticks and labeled blue. (b) Surface diagram of Apaf-1 protein showing the binding pockets. Piperine is shown in black color. (c) Interactions of piperine with the active site residues of Apaf-1. Interacting residues are shown as sticks and in hot pink color. Piperine is shown in yellow color with a ball and stick representation. Hydrogen bonds are labeled and shown as black dash lines. (d) 2D interaction diagram of piperine with Apaf-1.
